Chart of the Week IMB Net Production Income, Results for Top 20% and Bottom 20% of QPR Sample
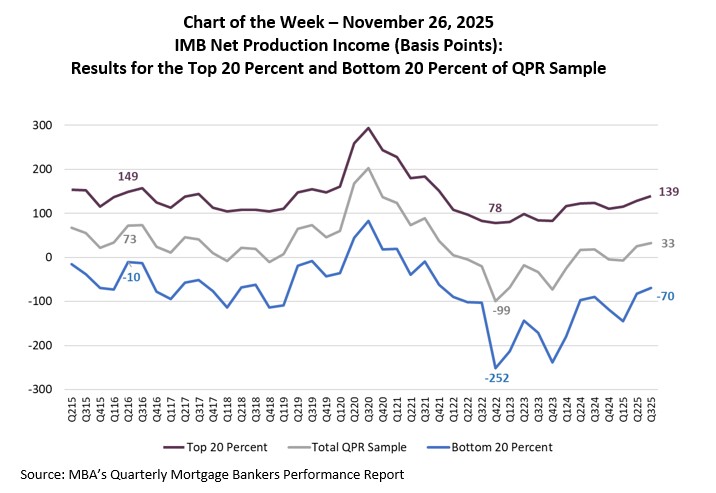
In the third quarter of 2025, a total sample of 333 Independent mortgage banks (IMBs) and mortgage subsidiaries of chartered banks were included in MBA’s Quarterly Mortgage Bankers Performance Report (“QPR”). The simple average pre-tax net production profit for these 333 firms was 33 basis points on each loan they originated, compared to 25 basis points in the second quarter of 2025.
For this Chart of the Week, we compare those companies in the top 20 percent for net production income in basis points versus those companies in the bottom 20 percent over the past ten years. The 67 companies in the top 20 percent cohort averaged 139 bps in net production income in the third quarter of 2025, while the 67 companies in the bottom 20 percent cohort reported an average net production loss of 70 basis points, a 209-basis-point spread across these two cohorts. Over the past ten years, the variance between the net production income for top and bottom performers has fluctuated. The spread between these two cohorts reached its narrowest 159 basis points in the second quarter of 2016 and its widest 330 basis points in the fourth quarter of 2022. Moreover, the average spread widened by almost 45 basis points between the first half and second half of the decade as market volatility increased.
Whether through product specialization, secondary execution, cost containment, or disciplined management in changing market conditions among other possible factors, the top-performing mortgage companies were able to generate healthy production profits even in the most difficult of times for the industry. The top 20 percent of companies remained profitable across all quarters from 2015 to 2025. At the same time, there are companies that struggled in all but the very best of times for the industry, with the bottom 20 percent losing money in all but four quarters over the past decade.
Note: Pre-tax net production income is defined as total revenues (fee income, secondary marketing income, value of capitalized servicing/servicing released premiums at origination and net warehouse spread) minus fully-loaded production costs (sales, fulfillment, production support and corporate costs), divided by production volume in dollars ($), multiplied by 10,000 for basis points, and divided by loan production count for dollars per loan.
– Jenny Masoud (jmasoud@mba.org); Marina Walsh, CMB (mwalsh@mba.org)