Chart of the Week: Four-Quarter House Price Change by State, as of Q1 2025
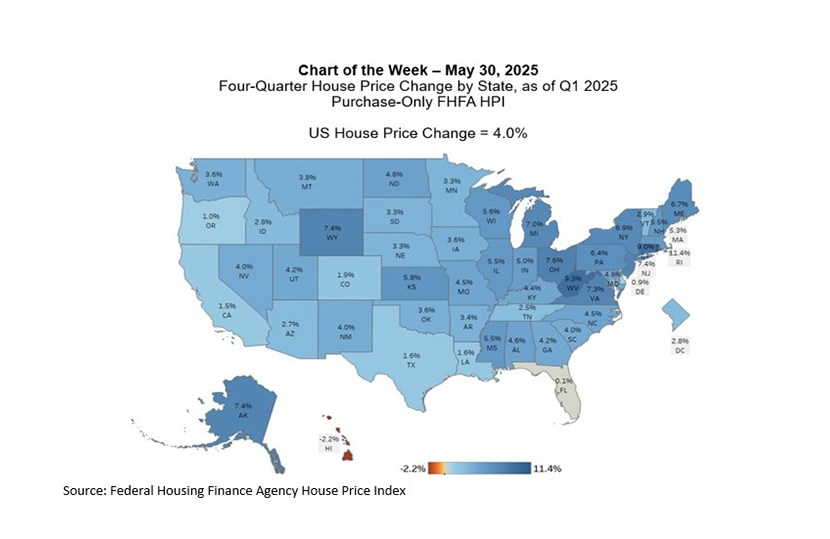
In the first quarter of 2025, U.S. house prices increased 4% compared to the first quarter of 2024, as reported by the Federal Housing Finance Agency. House price growth has seen positive annual growth since 2012 but has started to slow since reaching a peak of over 18% in 2022. Outside the post-pandemic period, the Q1 growth rate was the slowest since 2012.
House price trends vary greatly by geography, with annual price changes ranging from a decline of 2.2% in Hawaii to 11.4% growth in Rhode Island. States in the Mid Atlantic, New England, and Midwest continue to exhibit the strongest house price growth in the 6% range on average, driven by tight inventory conditions and challenges to home building, such as high costs and restrictive zoning. The Pacific and West South Central showed the lowest annual growth with annual growth with averages of less than 2%, as pandemic-era run-ups in prices have begun to reverse. Additional challenges for some housing markets include rising insurance costs and the availability of insurance, which are leading to lower demand and further depressing house prices.
MBA’s forecast for house prices is for a 1.3% growth rate at the end of 2025, further slowing to 0.3% by year-end 2026, as inventory continues to grow in many geographies even as housing demand remains relatively stable. However, local market conditions will continue to determine the timing of house price peaks and troughs and level of purchase activity, which will differ from market to market. In a previous Chart of the Week, we showed the variation in purchase mortgage applications trends across the larger states related to price and inventory conditions.
Joel Kan (jkan@mba.org)