Home Price Report Roundup: More Rebalancing
Three reports show a continuing trend of slowly receding home prices, with some markets coming back to earth faster than others. Here’s a summary of those reports:
S&P CoreLogic Case-Shiller: Price Gains Well Below Double-Digits
S&P Dow Jones Indices released its S&P CoreLogic Case-Shiller Indices, showing the National Home Price NSA Index reported a 7.7% annual gain in November, down from 9.2% in October. The 10-City Composite annual increase came in at 6.3%, down from 8.0%. The 20-City Composite posted a 6.8% year-over-year gain, down from 8.6%.
Miami led with an 18.4% year-over-year price increase, followed by Tampa at 16.9% and Atlanta at 12.7%. All 20 cities reported lower price increases in the year ending November from October.
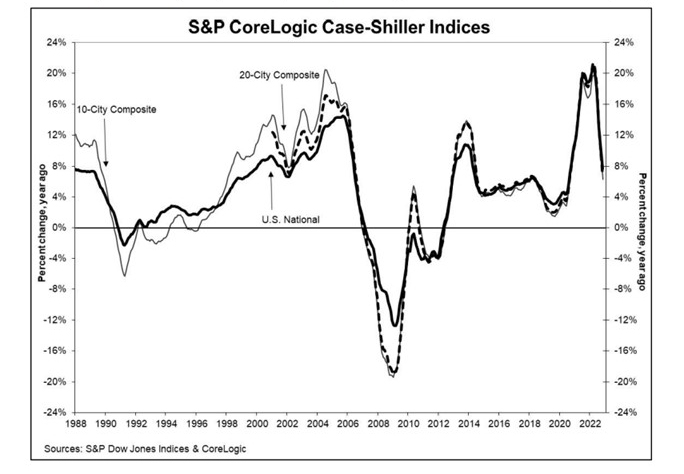
Month over month, before seasonal adjustment, the National Index posted an -0.6% month-over-month decrease in November, while the 10-City and 20-City Composites posted decreases of -0.7% and -0.8%, respectively. After seasonal adjustment, the National Index posted a month-over-month decrease of -0.3%, and the 10-City and 20-City Composites both posted decreases of -0.5%. All 20 cities reported declines before seasonal adjustments. After seasonal adjustments, 19 cities reported declines, with only Detroit increasing by 0.1%.
“November 2022 marked the fifth consecutive month of declining home prices in the U.S.,” said Craig J. Lazzara, Managing Director with S&P DJI. “As the Federal Reserve moves interest rates higher, mortgage financing continues to be a headwind for home prices. Economic weakness, including the possibility of a recession, would also constrain potential buyers. Given these prospects for a challenging macroeconomic environment, home prices may well continue to weaken.
“Home price growth continued its hasty deceleration at the end of 2022 as homebuyers and sellers decided to wait out the cold winter and, for some, shockingly high mortgage rates,” said CoreLogic Chief Economist Selma Hepp. “The surge in rates from 3% to 7% wiped out about 30% of homebuyers’ budget, significantly narrowing affordable home options. Sellers’ withdrawal was also visible in the large drop of new listings added to the market, leading to further shrinking of for-sale inventory to yet another all-time low. Nevertheless, falling mortgage rates in December did bring forward some renewed optimism among buyers. And, if mortgage rates continue trending lower, the 2023 spring home buying season may prove busier than many initially expected.”
FHFA: Home Prices Fall 0.1% in November; Up 8.2% Annually
The Federal Housing Finance Agency on Tuesday reported house prices fell 0.1 percent nationwide in November from October. The FHFA House Price Index reported house prices rose 8.2 percent from November 2021 to November 2022. The previously reported 0.0 percent price decline in October 2022 remained unchanged.
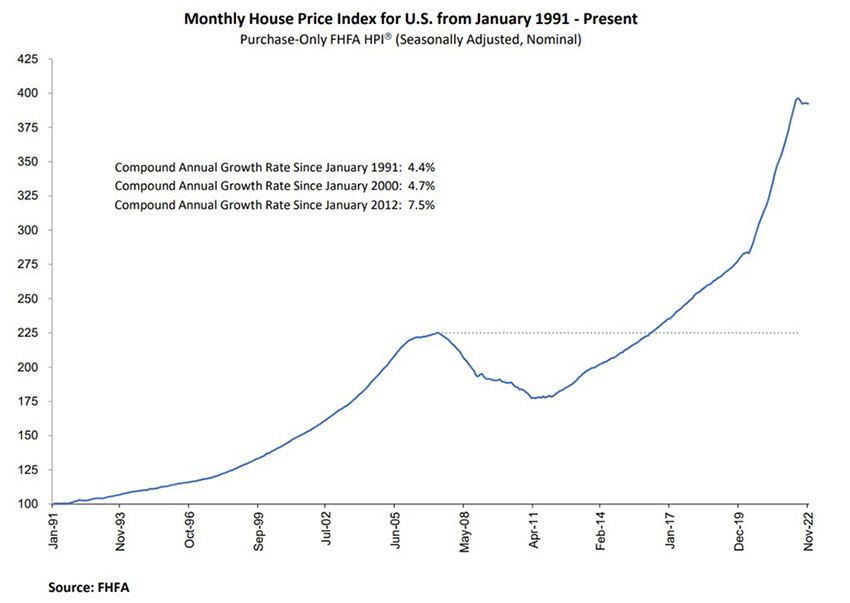
For the nine census divisions, seasonally adjusted monthly house price changes from October to November ranged from -1.1 percent in the Pacific division to +0.5 percent in the West North Central division. The 12-month changes were all positive, ranging from +2.4 percent in the Pacific division to +12.0 percent in the South Atlantic division.
“U.S. house prices were largely unchanged in the last four months and remained near the peak levels reached over the summer of 2022,” said Nataliya Polkovnichenko, Supervisory Economist in FHFA’s Division of Research and Statistics. “While higher mortgage rates have suppressed demand, low inventories of homes for sale have helped maintain relatively flat house prices.”
First American: Real House Prices Down—With Silver Lining
First American Financial Corp. Santa Ana, Calif., released its monthly Real House Price Index, reporting price declines across many markets—but those declines would have to be substantial to erase all of the equity gains accumulated by homeowners over the past few years.
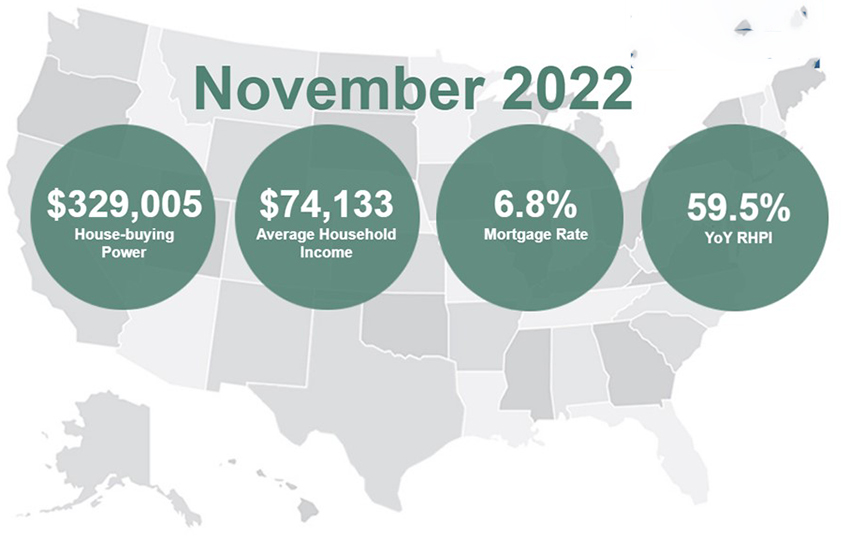
The report said real house prices decreased by 1.2 percent between October and November, but increased by 59.5 percent between November 2021 and November 2022. Consumer house-buying power—how much one can buy based on changes in income and interest rates—increased by 1.3 percent between October and November, but decreased 32.5 percent year over year.
The report noted median household income has increased by 3.5 percent since November 2021 and by 78 percent since January 2000. Real house prices are 41.7 percent more expensive than in January 2000, while unadjusted house prices are now 48 percent above the housing boom peak in 2006, while real, house-buying power-adjusted house prices are 0.8 percent above their 2006 housing boom peak.
“This rapid annual decline in affordability was driven by two factors — a 7.6 percent annual increase in nominal house prices and a 3.7 percentage point increase in the average 30-year, fixed mortgage rate compared with one year ago,” said First American Chief Economist Mark Fleming. “Even though household income increased 3.5 percent since November 2021 and boosted consumer house-buying power, it was not enough to offset the affordability loss from higher mortgage rates and still-strong nominal house price growth. The loss of affordability has prompted buyers to pull back from the market, putting downward pressure on prices. While still elevated by historical standards, nominal house price appreciation has slowed considerably since early 2022. Nationally, annual nominal house price growth peaked in March 2022 at nearly 21 percent, but has since decelerated by more than 13 percentage points to 7.6 percent in November.
Fleming noted while price changes vary by market, there is one trend that bodes well for all top 50 markets – much of the homeowner equity gained during the pandemic remains. For example, in both San Francisco and San Jose, house prices increased by 31 and 29 percent from February 2020 to their respective peaks in 2022. Kansas City and Hartford gained 48 and 40 percent from February 2020 to their respective peaks in 2022.
The report said states with the greatest year-over-year increase in the RHPI were Florida (+72.2), Alabama (+65.9 percent), New Hampshire (+64.3 percent), Georgia (+63.7 percent) and Alaska (+63.5 percent). No states reported a year-over-year decrease in the RHPI.
Among metros, markets with the greatest year-over-year increase in the RHPI were Miami (+81.1 percent), Indianapolis (+80.0 percent), Salt Lake City (+70.0 percent), Buffalo, N.Y. (+69.2 percent) and Jacksonville, Fla. (+67.2 percent). No markets reported a year-over-year decrease in the RHPI.