Home Prices Continue ‘Forceful Deceleration’
Tuesday’s reports confirm a steady, even “forceful” deceleration in home prices.
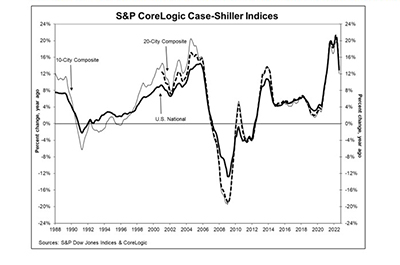
S&P Dow Jones Indices reported annual home prices slowed to 13 percent in August, down from nearly 16 percent in July—the largest single-month deceleration in the history of the S&P CoreLogic Case-Shiller Home Price Indices. But month over month, home prices fell by 1.1 percent.
In a separate report, the Federal Housing Finance Agency reported house prices fell nationwide in August, down 0.7 percent from the previous month. FHFA reported house prices rose 11.9 percent year over year.

S&P said year over year, the 10-City Composite annual increase came in at 12.1%, down from 14.9% in July. The 20-City Composite posted a 13.1% year-over-year gain, down from 16.0% in July. Miami led all 20 cities with a 28.6% year-over-year price increase, followed by Tampa at 28.0% and Charlotte at 21.3%. All 20 cities reported lower price increases in the year ending August.
Month over month, before seasonal adjustment, the U.S. National Index posted a -1.1% month-over-month decrease in August, while the 10-City and 20-City Composites posted decreases of -1.6%. After seasonal adjustment, the U.S. National Index posted a month-over-month decrease of -0.9%, while the 10-City and 20-City Composites posted decreases of -1.3%. All 20 cities reported declines before and after seasonal adjustments.
“The forceful deceleration in U.S. housing prices that we noted a month ago continued,” said Craig J. Lazzara, Managing Director with S&P DJI. “As the Federal Reserve moves interest rates higher, mortgage financing becomes more expensive and housing becomes less affordable. Given the continuing prospects for a challenging macroeconomic environment, home prices may well continue to decelerate.”
Separately, the FHFA House Price Index reported house prices rose 11.9 percent through August. The previously reported 0.6 percent price decline in July 2022 remained unchanged.
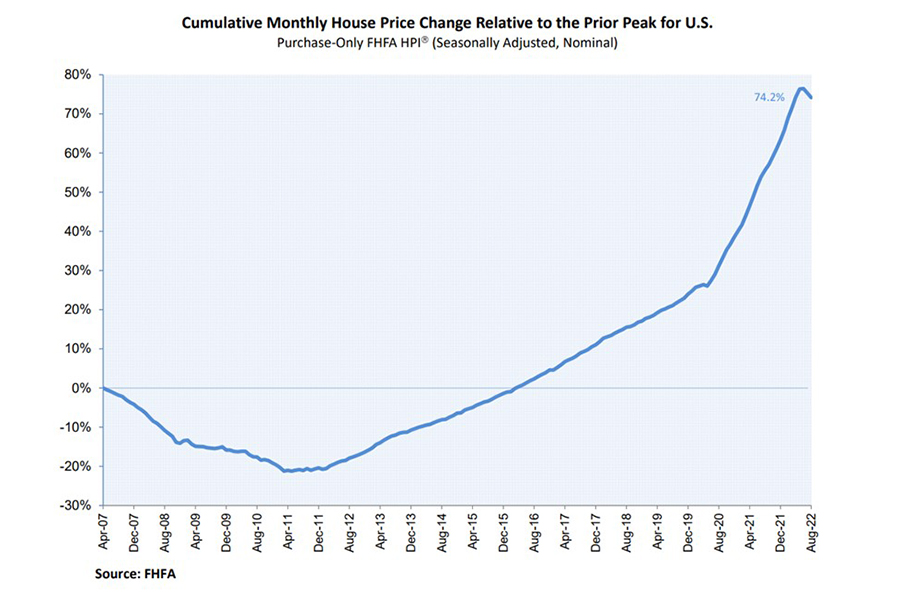
For the nine census divisions, seasonally adjusted monthly house price changes from July to August ranged from -2.0 percent in the Mountain division to +0.4 percent in the New England division. The 12-month changes were all positive, ranging from +7.4 percent in the Pacific division to +16.2 percent in the South Atlantic division.
“This is the first time since March 2011 that the index has seen two consecutive months of decline.” said Will Doerner, Supervisory Economist in FHFA’s Division of Research and Statistics. “The recent monthly decline solidifies the deceleration of 12-month house price growth that began earlier this year. Higher mortgage rates continued to put pressure on demand, notably weakening house price growth.”