House Prices Continue to Flatten
Reports from S&P Down Jones Indices, New York, and the Federal Housing Finance Agency show continued flattening of home prices nationwide, although they remain elevated in most markets.
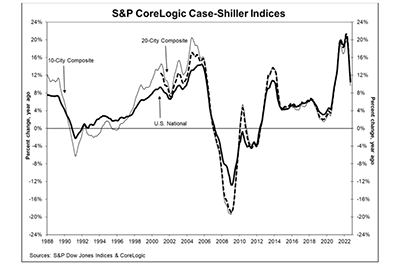
The S&P CoreLogic Case-Shiller National Home Price NSA Index reported a 10.6% annual gain in September, down from 12.9% in August. The 10-City Composite annual increase fell to 9.7%, down from 12.1% in August; the 20-City Composite posted a 10.4% year-over-year gain, down from 13.1% in August.
Miami led the 20-City Composite with a 24.6% year-over-year price increase, followed by Tampa at 23.8% and Charlotte at 17.8%. All 20 cities reported lower price increases in the year ending September from August.
Month over month, before seasonal adjustment, the National Index posted a -1.0% month-over-month decrease in September, while the 10-City and 20-City Composites posted decreases of -1.4% and -1.5%, respectively. After seasonal adjustment, the National Index posted a month-over-month decrease of -0.8%, and the 10-City and 20-City Composites both posted decreases of -1.2%. All 20 cities reported declines before and after seasonal adjustments.
“Despite considerable regional differences, all 20 cities in our September report reflect these trends of short-term decline and medium-term deceleration,” said Craig J. Lazzara, Managing Director with S&P DJI. “As the Federal Reserve continues to move interest rates higher, mortgage financing continues to be more expensive and housing becomes less affordable. Given the continuing prospects for a challenging macroeconomic environment, home prices may well continue to weaken.”
Separately, FHFA reported. house prices rose 12.4 percent from third quarter 2021 to third quarter 2022, The FHFA House Price Index said prices rose by 0.1 percent from the second quarter; month over month, the index rose by 0.1 percent in September from August.
“House prices were flat for the third quarter but continued to remain above levels from a year ago.” said William Doerner, Supervisory Economist in FHFA’s Division of Research and Statistics. “The rate of U.S. house price growth has substantially decelerated. This deceleration is widespread with about one-third of all states and metropolitan statistical areas registering annual growth below 10 percent.”
The report said nationally, the U.S. housing market has experienced positive annual appreciation each quarter since the start of 2012.
House prices rose in all 50 states and the District of Columbia between the third quarters of 2021 and 2022. States with the highest annual appreciation were: 1) Florida 22.7 percent; 2) South Carolina 18.4 percent; 3) Tennessee 17.9 percent; 4) North Carolina 17.4 percent; and 5) Georgia 16.7 percent. States showing the lowest annual appreciation were: 1) District of Columbia 1.8 percent; 2) Oregon 7.6 percent; 3) California 7.6 percent; 4) Minnesota 7.7 percent and 5) Louisiana 8.3 percent.
House prices rose in all but two of the top 100 largest metropolitan areas over the past four quarters. Annual price increase was greatest in North Port-Sarasota-Bradenton, Fla., where price increased by 29.2 percent. Two metropolitan areas that experienced price declines are San Francisco-San Mateo-Redwood City, Calif., and Oakland-Berkeley-Livermore, Calif., where prices decreased by 4.3 percent and 0.6 percent, respectively.
Of the nine census divisions, the South Atlantic division recorded the strongest four-quarter appreciation, posting a 17.0 percent gain between third quarter 2021 and 2022. Annual house price appreciation was weakest in the Pacific division, where prices rose by 8.3 percent between third quarter 2021 and 2022.