MBA Chart of the Week Mar. 25 2022: IMB Net Production Income/Average Production Volume
MBA released its latest Quarterly Performance Report for the fourth quarter last week. The total sample of 359 independent mortgage banks and mortgage subsidiaries of chartered banks earned an average pre-tax production profit of 38 basis points (or $1,099) on each loan they originated. This was down from the reported average net production income of 89 basis points (or $2,594) in the third quarter.

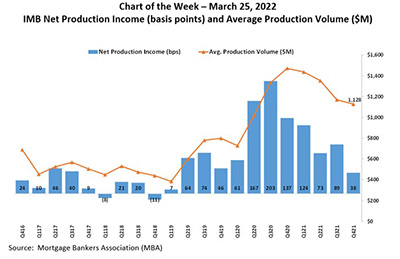
In this week’s MBA Chart of the Week, we show the average net production income from fourth-quarter 2016 through fourth-quarter 2021, along with the average production volume per company.
A combination of lower revenues and higher expenses contributed to the decrease in net production income in the final three months of last year. Revenues (fee income, net secondary marketing income and warehouse spread) decreased to 353 basis points, while expenses (commissions, compensation, occupancy, equipment, and other production expenses and corporate allocations) reached a study-high of $9,470 per loan. The average quarterly net production income, from the third quarter of 2008 to the most recent quarter, is 56 basis points.
Average production volume remained strong by historical standards in fourth-quarter 2021. After peaking in the fourth quarter of 2020 at $1.47 billion per company, the average production volume decreased over the next four quarters. Even with this decline, the average production volume was $1.13 billion per company last quarter, the sixth highest level of volume in the history of MBA’s study.
Jenny Masoud jmasoud@mba.org; Marina Walsh, CMB mwalsh@mba.org.