Black Knight: Signs of Home Price Cooling as Inventory Levels Improve
Black Knight, Jacksonville, Fla., said home price growth slowed in 97 of the 100 largest U.S. housing markets in May, with the national annual appreciation rate pulling back by more than a full percentage point from April.
The company’s monthly Mortgage Monitor report said home price appreciation slowed to 19.3% in May from a revised 20.4% in April, marking the largest single-month deceleration since 2006. Despite the pullback, Black Knight said home prices still rose by 1.5% month over month – nearly twice the historical average for May.
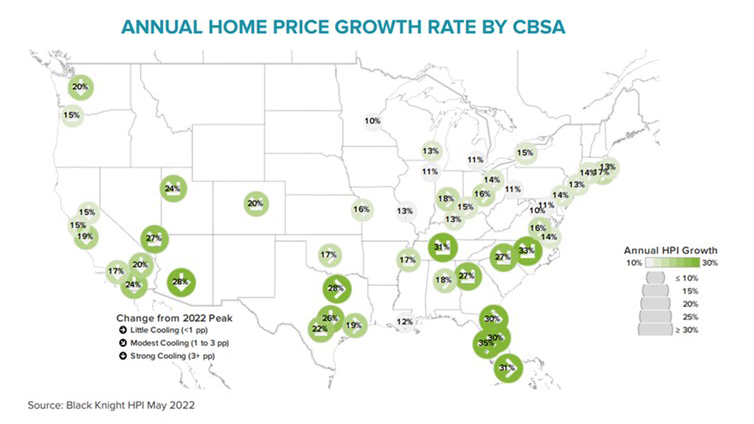
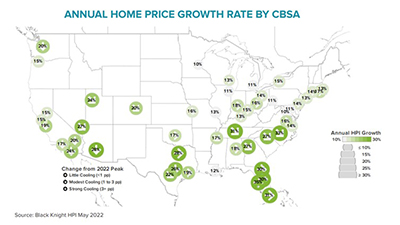
The report said markets experiencing the strongest cooling in home price growth are those with comparatively poor affordability levels and low inventory deficits.
“While any talk of home values and 2006 might set off alarm bells for some, the truth is that price gains would need to see deceleration at this rate for more than 12 months just to get us back to a ‘normal’ 3-5% annual growth rate,” said Black Knight Data & Analytics President Ben Graboske. “That said, the pace of deceleration could very well increase in the coming months, as we’ve already begun to see in select markets such as Austin, Boise and Phoenix.”
Graboske noted the record-low listing inventory that had been driving these price gains nationwide has also begun to improve, albeit slightly. I”ndeed, even with an increase in active listings of 107,000 in May – nearly double the traditional seasonal rise for the month – we are still 60% below the number of active listings we would normally see at this time of year,” he said. “All major markets are still facing inventory deficits, but some have seen their shortages shrink much faster than others. Among these are some of the hottest housing markets in recent years: San Francisco, San Jose and Seattle. Unsurprisingly, these are also among the markets seeing the strongest levels of cooling so far this year, with annual home price growth rates in each down more than three percentage points in recent months.”
Graboske noted with 30-year rates hovering near 6% and home prices up nearly 11% since the start of 2022, home affordability is at its worst point since the mid-1980s – when sharp Fed hikes led to high double-digit mortgage rates that resulted in a greater than 50% payment-to-income ratio. “The affordability challenge back then was almost entirely driven by the interest rate environment, while incomes largely kept up with home price growth,” he said. Today’s falling affordability is due in equal measure to rising rates and soaring home values largely driven by historically low inventory levels. The average home price is now more than six times the median household income, the largest multiple on record since the early 1970s.
The report said as of mid-June 2022, it takes 36.2% of the median household income to make the mortgage payment on the average- priced home purchase, well above the 34.1% post-1980s peak in July 2006.