MBA: Share of Mortgage Loans in Forbearance Decreases to 1.05%
Loans in forbearance fell to another pre-pandemic low to just barely above 1%, the Mortgage Bankers Association reported Monday.
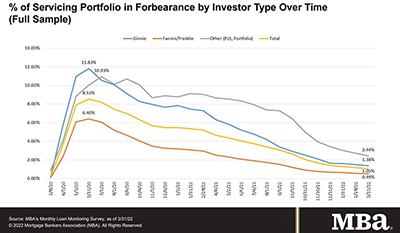
The MBA monthly Loan Monitoring Survey reported loans now in forbearance decreased by 13 basis points to just 1.05% of servicers’ portfolio volume as of March 31, from 1.18% the prior month. MBA estimates 525,000 homeowners remain in forbearance plans.

The survey reported the share of Fannie Mae and Freddie Mac loans in forbearance decreased by 7 basis points to 0.49%. Ginnie Mae loans in forbearance decreased by 12 basis points to 1.38%, while the forbearance share for
portfolio loans and private-label securities declined by 28 basis points to 2.44%.
“March was another month of lower forbearance rates and a higher share of overall loans and forbearance-related workout loans that are current,” said Marina Walsh, CMB, MBA Vice President of Industry Analysis. “The share of loans in forbearance continues to dwindle and is just 5 basis points shy of hitting 1 percent — or 500,000 homeowners — after peaking at 4.3 million borrowers in June 2020. It has been a remarkable recovery for many homeowners in less than two years.”
Key findings of MBA’s Loan Monitoring Survey – March 1 – 31
• Total loans in forbearance decreased by 13 basis points in March from February: from 1.18% to 1.05%.
o By investor type, the share of Ginnie Mae loans in forbearance decreased from 1.50% to 1.38%.
o The share of Fannie Mae and Freddie Mac loans in forbearance decreased from 0.56% to 0.49%.
o The share of other loans (e.g., portfolio and PLS loans) in forbearance decreased from 2.72% to 2.44%.
• Loans in forbearance as a share of servicing portfolio volume (#) as of March 31:
o Total: 1.05% (previous month: 1.18%)
o Independent Mortgage Banks: 1.29% (previous month: 1.44%)
o Depositories: 0.86% (previous month: 0.97%)
• By stage, 29.7% of total loans in forbearance are in the initial forbearance plan stage, while 57.2% are in a forbearance extension. The remaining 13.1% are forbearance re-entries, including re-entries with extensions.
• Of the cumulative forbearance exits for the period from June 1, 2020, through March 31, 2022, at the time of forbearance exit:
o 29.2% resulted in a loan deferral/partial claim.
o 18.9% represented borrowers who continued to make their monthly payments during their forbearance period.
o 17.1% represented borrowers who did not make all of their monthly payments and exited forbearance without a loss mitigation plan in place yet.
o 15.4% resulted in a loan modification or trial loan modification.
o 11.4% resulted in reinstatements, in which past-due amounts are paid back when exiting forbearance.
o 6.7% resulted in loans paid off through either a refinance or by selling the home.
o The remaining 1.3% resulted in repayment plans, short sales, deed-in-lieus or other reasons.
• Total loans serviced that were current (not delinquent or in foreclosure) as a percent of servicing portfolio volume (#) rose to 95.47% in March from 94.94% in February (on a non-seasonally adjusted basis).
o States with the highest share of loans that were current as a percent of servicing portfolio: Idaho, Washington, Colorado, Utah and Oregon.
o States with the lowest share of loans that were current as a percent of servicing portfolio: Louisiana, Mississippi, New York, West Virginia and Oklahoma.
• Total completed loan workouts from 2020 and onward (repayment plans, loan deferrals/partial claims, loan modifications) that were current as a percent of total completed workouts rose to 83.67% last month from 82.26% in February.
MBA’s monthly Loan Monitoring Survey (replaces MBA’s Weekly Forbearance and Call Volume Survey) represents 73% of the first-mortgage servicing market (36.4 million loans).
To subscribe to the full report, go to www.mba.org/loanmonitoring.