MBA Chart of the Week May 17, 2021: Cumulative Eviction Filings, 2020 v. Historical Average
On Wednesday, May 5, U.S. District Court Judge Dabney Friedrich issued an order vacating the U.S. Centers for Disease Control and Prevention’s national eviction moratorium, but also put a temporary pause on the order, meaning that (as of this writing) the CDC moratorium, which is scheduled to expire on June 30, remains in place. A number of state-level bans also remain.
But with the number of Covid-19 cases, hospitalizations and deaths falling, increased attention is being paid to when, and how, to allow the various moratoriums to phase-out.
There is relatively limited national data available on evictions. One key source of information during the pandemic has been Princeton University’s Eviction Lab. The Eviction Lab data tracks eviction filings rather than the evictions themselves, and the two numbers vary, particularly as some courts have allowed the filing of eviction cases to continue even while state and federal orders banned their enforcement.
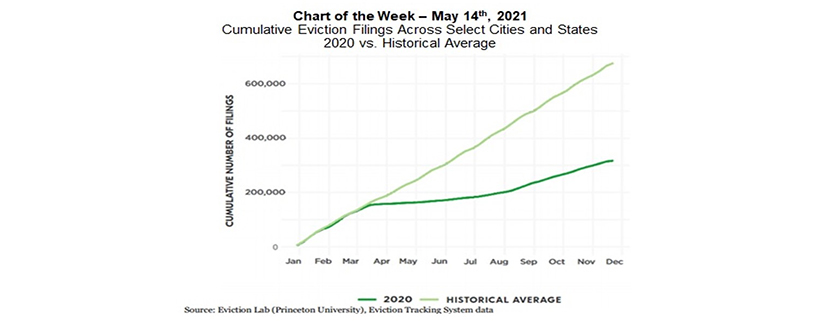
In the Consumer Financial Protection Bureau’s March 1 report “Housing insecurity and the COVID-19 Pandemic,” the chart above was used, showing eviction filings in 2020 compared to previous years.
Counterintuitively, during the year of the onset of the pandemic, when the unemployment rate jumped to 14.8 percent and more than 20 million jobs were lost, the number of eviction filings in selected cities and states fell to half what it had been historically. The declines were likely driven by robust federal supports in the form of stimulus checks, expanded unemployment insurance benefits and more, in addition to federal and state eviction moratoriums. It should be noted that the number of executed evictions likely fell even further compared to historical norms than did the number of filings.
As eviction moratoriums are phased out, much attention will likely be paid to increases in the number of filings that follow. When interpreting those numbers, it will be critical to consider whether the comparison is being made to the historical averages or to the pandemic-reduced rates.
—Jamie Woodwell jwoodwell@mba.org.