Home Prices Jump on Robust Demand; Housing Gains at 15-Year High
(Chart courtesy Zillow.)
Home prices are rising at rates not seen in years, with four reports—from Standard & Poor’s, Zillow, the Federal Housing Finance Agency and First American Financial Corp.—confirming no apparent letup.
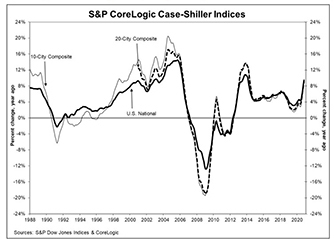
Yesterday, the S&P CoreLogic Case-Shiller Indices reported a 9.5% annual gain in home prices in November, up from 8.4% in October. The 10-City Composite annual increase came in at 8.8%, up from 7.6% in the previous month. The 20-City Composite posted a 9.1% year-over-year gain, up from 8% in the previous month.
Phoenix led the 19 metros surveyed (Detroit data remains incomplete) with a 13.8% year-over-year price increase, followed by Seattle at 12.7% and San Diego at 12.3%. All 19 cities reported higher price increases in the year ending November from a year ago.
Month over month, the U.S. National Index posted a 1.1% increase, while the 10-City and 20-City Composites posted increases of 1.2% and 1.1% respectively, before seasonal adjustment in November. After seasonal adjustment, the National Index posted a month-over-month increase of 1.4%, while the 10-City and 20-City Composites both posted increases of 1.4%. All 19 cities (excluding Detroit) reported increases before and after seasonal adjustment.
“The trend of accelerating home prices that began in June 2020 has now reached its sixth month with November’s emphatic report,” said Craig J. Lazzara, Managing Director and Global Head of Index Investment Strategy at S&P Dow Jones Indices. “As COVID-related restrictions began to grip the economy last spring, their effect on housing prices was unclear. Price growth decelerated in May and June before beginning a steady climb upward. November’s report continues that acceleration in a particularly impressive manner.
Lazzara noted recent data are consistent with the view that COVID has encouraged potential buyers to move from urban apartments to suburban homes. “This may represent a true secular shift in housing demand, or may simply represent an acceleration of moves that would have taken place over the next several years anyway,” he said. “Future data will be required to address that question.”
The report said as of November, average home prices for the MSAs within the 10-City and 20-City Composites are exceeding their winter 2007 levels.
“The housing market continued to hold stronger than expected throughout the last months of 2020 and despite increases in infection rates across the country,” said CoreLogic Deputy Chief Economist Selma Hepp. “With mortgage rates steadily falling through the end of the year and buyers realizing that the pandemic is still far from over, robust demand was not fazed by traditional seasonal slowdown. And given that we are unsure of when social interaction will be safe again, homebuyers will continue to compete for fewer and fewer homes available for sale, which will drive home prices higher.”
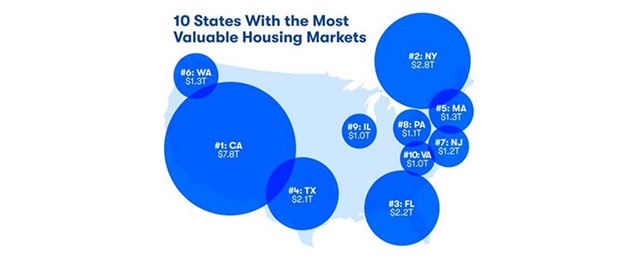
In a separate report, Zillow, Seattle, said 2020 U.S. housing market gains were the biggest in 15 years.
Zillow reported U.S. housing gained nearly $2.5 trillion in value in 2020 — the most in a single year since 2005. The full stock of U.S. housing is now worth $36.2 trillion.
“2020 was a record-breaking year for the housing market with intense competition among buyers driving up home prices,” said Zillow economist Treh Manhertz. “While many faced financial hardships because of the pandemic, others fortunate enough to maintain stable income took a step back to contemplate what they wanted their home to be and hopped on Zillow to help find a place that filled their wish list. Builder confidence, perhaps in reaction to the boosted demand, hit record highs and more homes are being built as a result. Add that together and you see why the housing market gained more than in any year since the Great Recession.”
Zillow expects 2021 to be even stronger, possibly exceeding last year’s $2.5 trillion gain. With mortgage rates also likely to rise from today’s near-record low levels, buyers considering a move may want to do so soon before their potential monthly payments rise.
More than a fifth (21.4%) of the nation’s housing value resides in California. Homes in California are worth a cumulative $7.8 trillion, more than the next three states combined, and the state boasts four of the 10 metro areas with the highest total housing value — Los Angeles, San Francisco, San Jose and San Diego.
North Dakota ($64 billion), Wyoming ($70 billion) and South Dakota ($72 billion), three of the least-populous states, have the smallest shares of the U.S. housing market. Alaska was the only state where the housing stock lost value in 2020, down 1.8% or about $1.5 billion. That was caused by relatively low levels of new construction and declining values among homes in Alaska’s top tier.
Over the past decade, the total value of the housing stock has more than doubled in six states. Idaho saw the most, gaining 149% since 2011. Most of that growth comes from the Boise metro, where the total housing stock has more than tripled in value during that time, most of any of the 100 largest U.S. metros. Nevada (146.3%), Utah (126.2%), Arizona (116.5%), Colorado (111.6%) and Washington (108%) also saw their total housing market value double over the past decade.
Even the somewhat-conservative Federal Housing Finance Report acknowledged robust housing growth. The FHFA House Price Index rose by 1 percent in November and by 11 percent year over year.
For the nine census divisions, seasonally adjusted monthly house price changes from October 2020 to November 2020 ranged from +0.3 percent in the West South-Central division to +1.6 percent in the Pacific division. The 12-month changes ranged from +8.7 percent in the West South-Central division to +14.0 percent in the Mountain division.
“House prices have risen by at least one percent for six consecutive months,” said Lynn Fisher, FHFA Deputy Director of the Division of Research and Statistics. “The acceleration has been slowing but annual gains now outpace the prior housing boom. Current conditions can be explained by fundamentals, including low rates and tight housing supply, which have been intensified by the pandemic.”
Menwhile, First American Financial Corp., Santa Ana, Calif., said its Real House Price Index showed prices declined by 6.2 percent year over year in November.
“Even though nominal house prices continued to surge, affordability improved in November as two of the three key drivers of the RHPI, household income and mortgage rates, swung in favor of increased affordability,” said Mark Fleming, chief economist at First American. “Real house prices declined by 6.2 percent relative to one year ago, thanks to the benefit of increased buying power.” While mortgage rates fell in November, in more recent data from January 2021, mortgage rates have increased slightly due to a more positive economic outlook. The uptick in rates sparked questions about how the housing market will react as rates rise.”
The report said real house prices increased 0.5 percent between October and November. Consumer house-buying power, how much one can buy based on changes in income and interest rates, increased 1.0 percent between October and November and increased 18.9 percent year over year. Median household income has increased 5.8 percent since November 2019 and 72.1 percent since January 2000. Real house prices are 26 percent less expensive than in January 2000.
First American reported the only state with a year-over-year increase in the RHPI was Wyoming (+2.3 percent). States with the greatest year-over-year decrease in the RHPI were California (-9.3 percent), Massachusetts (-8.5 percent), Louisiana (-8.5 percent), New York (-7.7 percent), and Hawaii (-7.7 percent).
Among metros tracked by First American, markets with the greatest year-over-year increase in the RHPI were Cleveland (+4.7 percent), Pittsburgh (+2.4 percent), Kansas City, Mo. (+2.3 percent), Hartford, Conn. (+1.2 percent) and Memphis, Tenn. (+0.7 percent). Markets with the greatest year-over-year decrease in the RHPI were San Francisco (-17.5 percent), San Jose, Calif. (-14.0 percent), Boston (-12.2 percent), Miami (-11.0. percent), and San Diego (-9.7 percent).