Home Price Reports: Housing Market at Full Speed
If home prices are cooling off, it’s not evident in the numbers: reports from S&P Dow Jones Indices and the Federal Housing Finance Agency show home prices with annual gains of nearly 20 percent.
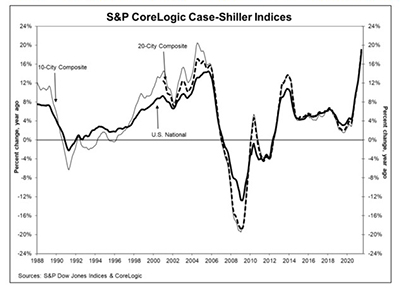
The S&P CoreLogic Case-Shiller Indices reported a 18.6% annual gain in June, up from 16.8% in May. The 10-City Composite annual increase came in at 18.5%, up from 16.6% in May, while the 20-City Composite posted a 19.1% year-over-year gain, up from 17.1% in May.
Phoenix led the 20-City Composite with a 29.3% year-over-year price increase, followed by San Diego at 27.1% and Seattle at 25.0%. All 20 cities reported higher price increases in the year ending June 2021.
Month over month, before seasonal adjustment, the U.S. National Index posted a 2.2% increase in June, while the 10-City and 20-City Composites posted increases of 1.8% and 2.0%, respectively. After seasonal adjustment, the U.S. National Index posted a month-over-month increase of 1.8%, while the 10-City and 20-City Composites posted increases of 1.6% and 1.8%, respectively. All 20 cities reported increases before and after seasonal adjustments.
“June 2021 is the third consecutive month in which the growth rate of housing prices set a record,” said Craig J. Lazzara, Managing Director and Global Head of Index Investment Strategy at S&P DJI. “The last several months have been extraordinary not only in the level of price gains, but in the consistency of gains across the country.”
Lazzara said the strength in the U.S. housing market is being driven in part by reaction to the COVID pandemic, as potential buyers move from urban apartments to suburban homes. “June’s data are consistent with this hypothesis,” he said. “This demand surge may simply represent an acceleration of purchases that would have occurred anyway over the next several years. Alternatively, there may have been a secular change in locational preferences, leading to a permanent shift in the demand curve for housing.”
The report said as of June, average home prices for the MSAs within the 10-City and 20-City Composites are exceeding their winter 2007 levels.
“While the housing market feels like it has legs that never get tired, inventory and affordability constraints are still expected to put a damper on price growth,” said Selma Hepp, Deputy Chief Economist with CoreLogic, Irvine, Calif. “Some early data suggests that the buyer frenzy experienced this spring is tapering, though many buyers still remain in the market. Nevertheless, less competition and more for-sale homes suggest we may be seeing the peak of home price acceleration. Going forward, home price growth may ease off but stay in the double digits through year-end.”
Meanwhile, FHFA reported U.S. house prices rose 17.4 percent year over year through the second quarter. The FHFA House Price Index reported house prices rose by 4.9 percent quarter over quarter, and its seasonally adjusted monthly index for June rose by 1.6 percent from May.
“During the second quarter, house prices peaked in June with an 18.8 percent growth rate compared to a year ago,” said Dr. Lynn Fisher, Deputy Director of FHFA’s Division of Research and Statistics. “For the quarter, annual gains surpassed 20 percent in the Mountain, New England, and Pacific census divisions and in all of the top 20 metro areas.”
FHFA said house prices have risen for 40 consecutive quarters, or since September 2011. House prices rose in all 50 states and the District of Columbia year over year; states with the highest annual appreciation were 1) Idaho 37.1 percent; 2) Utah 28.3 percent; 3) Arizona 23.9 percent; 4) Montana 23.7 percent; and 5) Rhode Island 23.7 percent. The states showing the lowest annual appreciation were: 1) Alaska 8.2 percent; 2) North Dakota 8.7 percent; 3) Louisiana 9.6 percent; 4) Mississippi 11.4 percent; and 5) Iowa 11.5 percent.
FHFA said house prices rose in all of the top 100 largest metropolitan areas over the last four quarters. Annual price increases were greatest in Boise City, Idaho, where prices increased by 41.1 percent. Prices were weakest in San Francisco-San Mateo-Redwood City, CA, where they increased by 4.5 percent.
Of the nine census divisions, the Mountain division experienced the strongest four-quarter appreciation, posting a 22.9 percent gain. The Mountain division has led in annual growth for 15 quarters. Annual house price appreciation was weakest in the West North Central division, where prices rose by 14.9 percent.