Monday Report: Red-Hot Housing Markets and a Time-Capsule Survey
This morning’s Monday Report features stories that confirm the housing markets remain hot, regardless of location or political preference; what that might mean for down payments; and a housing survey that, thanks to the coronavirus pandemic, was obsolete the moment it was released.
HUD/Census American Survey Offers Pre-Pandemic Insights
Last week, HUD and the Census Bureau released its 2019 American Housing Survey, which, given everything that’s happened in 2020 so far, feels like a long-ago time capsule.
The survey provides statistics from 2019—a bygone era in which there was no coronavirus pandemic, no economic shutdown, no emergency forbearance, no need for a foreclosure/eviction moratorium and record-low unemployment. It feels downright nostalgic.
Seth Appleton, HUD Assistant Secretary for Policy Development and Research, put the best possible spin: “Our hope is that the new 2019 American Housing Survey…can serve as a baseline for which to assess how American households are currently coping with the economic impacts of COVID-related job losses, which interrupted a historic period of economic growth and opportunity.”
Among the report’s pre-pandemic findings:
–the percentage of American renter households spending 30 percent or more of their income on housing costs held steady at 51 percent between 2017 and 2019.
–85 percent of households indicated they had high food security in 2019 compared to 82 percent in 2015.
–Nearly 3.5 million homeowners plan to make home improvements to improve the accessibility of their homes. “As the population grows older, it is important to address their needs, including home modifications to improve accessibility,” Appleton said. “Millions of households may benefit from accessibility improvements.”
–The median rent was $909 per month while the median mortgage cost was $975. The median total cost of utilities was $210. The median cost for electricity was $109 per month and the median cost of water was $50 per month.
–The median square feet per person was 700 in 2019. For Black alone householders, the median square feet per person was 622 in 2019, an increase from 601 in 2017. For homes with Hispanic householders the median square feet per person was 452 in 2019, an increase from 450 in 2017. More than 28 million households (23.8 percent of all households) live in homes with more people than bedrooms.
–Homeowners performed more than 114 million home improvement projects between summer 2017 and summer 2019, costing $521.8 billion. Of these projects, 42.7 million were completed as Do-It-Yourself projects.
–More than half of homeowners are estimated to have made an improvement to their home between summer 2017 and summer 2019. Between 2017 and 2019, an estimated 273,000 homeowners spent $3.7 billion on bathroom additions or renovating existing rooms to become bathrooms. The median cost per addition or renovation was $10,000. Bathroom remodels were about 20 times more common and one-third the cost, with an estimated 5.6 million homeowners spending $37.3 billion, and a median cost per remodel of $3,300.
The survey includes summary tables for the nation, for the 15 largest metropolitan areas, 9 states and 10 additional large metropolitan areas.
Zillow: Home Values Soar Even Higher in August as Inventory Tightens
Zillow, Seattle, said competition among buyers drove rapid sales and pushed values up while the rental market softened.
The August Zillow Real Estate Market Report said U.S. home values grew to $256,663 in August, a 0.7% increase from July, the largest monthly increase since 2013. Meanwhile, low demand continues to push rents lower — typical rent dropped 0.3% from July to $1,771 in August, the biggest monthly decrease since 2017.
Year over year, home values increased by 5.1% in August, the largest annual rise since March 2019. Markets with the highest year-over-year increases in home values were Phoenix (10.5%), San Jose (10.3%) and Seattle (9.2%). The smallest year-over-year gains in home values among major metros were seen in Chicago (1.9%), New York (2.3%) and San Francisco (2.7%).
“American home shoppers faced an historic shortage of listings to choose from this summer, and that scarcity is now reflected in rapidly appreciating home values after a sluggish start to the home shopping season this spring,” said Zillow economist Jeff Tucker. “Builders are racing to catch up with demand, and rising prices should encourage more potential sellers to come off the sidelines and list. Still, the shortage of inventory should keep housing markets unusually tilted in sellers’ favor this autumn.”
The report said nationwide, demand continued to outpace supply. Homes continue to fly off the market at a record pace and inventory is contracting, according to the most recent Zillow weekly housing market data. Listings’ typical time on the market was 14 days, as of the week ending Sept. 12. That’s 14 days faster than the year before.
Zillow reported while the for-sale market has strengthened since April, the rental market has softened. The U.S. has seen yearly rent price appreciation decline every month since the pandemic began, dropping from 3.8% year-over-year rent growth in February to just 0.7% in August. The typical U.S. rent was $1,771 in August, down 0.3% from July, the largest monthly decrease seen since September 2017.
“Rents softened further this August, especially in New York and the San Francisco Bay Area,” Tucker said. “Rental demand has been battered by still-elevated unemployment as well as some renters opting out of expensive markets with their ability to work remotely during the pandemic. The rental market may also be feeling an early gust of demographic headwinds, as the bumper crop of Millennials in their early 30s begin making the leap to homeownership.”
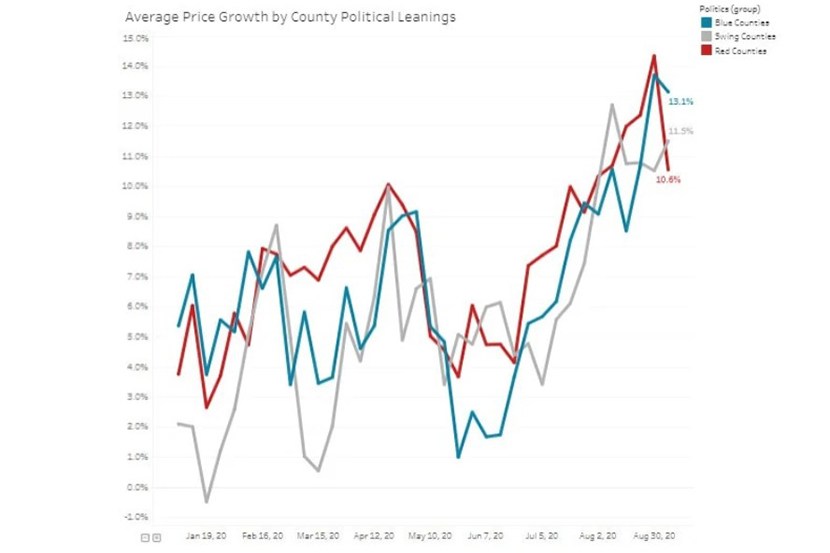
Redfin: Hot Housing Market Spans Political Spectrum
With major U.S. elections less than eight weeks away, spinning housing data for political purposes might seem gimmicky. But when the housing market is as hot as can be, said Redfin, Seattle, politics might not matter.
The company’s weekly housing report noted home prices rose regardless of a state’s “blue,” “red” or “purple” status. Redfin said the median home price in blue counties nationwide rose 13.1% from a year earlier to $346,000 during the four weeks ending September 6. Prices rose 11.5% to $259,500 in swing counties, and rose y 10.6% to $209,000 in red counties.
“Homeowners in counties of all colors—blue, red and purple—are benefiting from a strong housing market even during this deep recession,” said Redfin chief economist Daryl Fairweather. “Home values are up, which is great financial news if you’re a homeowner, regardless of your politics. But rising prices and tight supply mean it’s a tough landscape for first-time homebuyers. Many of them have long been priced out of urban blue counties and are searching in suburban swing counties and more rural areas. This trend is being exacerbated by the pandemic-driven work-from-home culture, which is causing many homebuyers to place more emphasis on indoor and outdoor space and less on commute times.”
Lack of inventory helps—or hurts, depending on your perspective. Redfin said the number of homes actively listed for sale was way down from a year earlier in all areas, with supply tightening the most in swing counties. Total housing supply dropped nearly 35% year over year in swing counties in the four weeks ending September 6, compared with a 32% dip in red counties and a 22.2% decline in blue counties.
“Supply is dropping the most in swing counties because they tend to be made up of suburban neighborhoods, where there are far more homebuyers than sellers right now,” Fairweather said.
First American: How Rising Home Prices Could Impact Downpayment Size
First American Financial Corp., Santa Ana, Calif., said historically low mortgage rates have fueled demand and increased home buyers’ purchasing power amid an ongoing housing supply shortage. However, the widening imbalance between housing supply and demand has pushed house prices higher. Some now fear that the rise in home prices is keeping first-time home buyers on the sidelines by increasing the the down payment.
“As home prices rise, the amount needed for a down payment, a fixed percentage of the home’s purchase price, will also increase,” said First American Deputy Chief Economist Odeta Kushi. “The question is whether that increase is large enough to constitute a real hurdle for home buyers.”
First American said given the median home price for the top 10 most populous U.S. markets and assuming a 3 percent down payment, the amount by which the down payment would increase if annual house price appreciation in each market remained at July’s pace, varying from 6 to 11 percent, ranges from $400 to as much as $1,400. A down payment below 20 percent also incurs private mortgage insurance, usually between 0.5 and 1 percent of the loan amount. However, the PMI is a monthly cost, rather than an upfront one, and was likely already considered by a home buyer planning to put down the minimum amount.
“Potential first-time home buyers tend to be younger and do not have the equity from the sale of an existing home to bring to the closing table,” Kushi said. “The most significant impediment for first-time home buyers has always been and remains the challenge of saving the money for a down payment. However, first-time home buyers have a variety of low down payment options, so for those who were already planning to buy and had a down payment lined up, the additional down payment burden from rising house prices may be a lot less than many expect.”