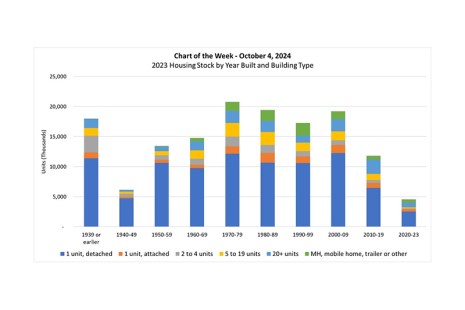
In this week’s MBA Chart of the Week, we show the stock of homes in the U.S. by the decade built and by building type.
Tag: American Housing Survey
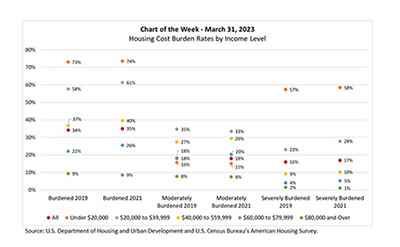
MBA Chart of the Week Mar. 31, 2023: Housing Cost Burden Rates by Income Level
In this week’s MBA Chart of the Week, we look at housing cost ratios by household income level, using data from the 2021 American Housing Survey.
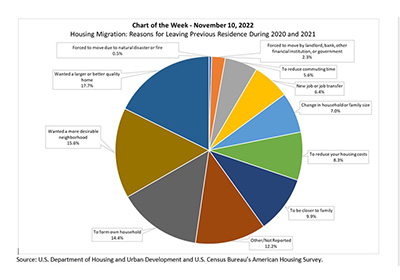
MBA Chart of the Week Nov. 10 2022: Housing Migration
This week’s MBA Chart of the Week shows the reasons for leaving one’s previous residence. The three main reasons in the 2021 AHS are wanting a larger or better-quality home (17.7%), wanting a more desirable neighborhood (15.6%) and forming their own household (14.4%).
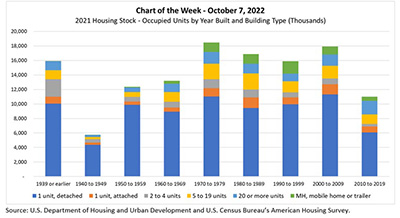
MBA Chart of the Week Oct. 7, 2022: 2021 Housing Stock
In this week’s MBA Chart of the Week, we show the stock of occupied homes in the U.S. by the decade built and by building type. The chart indicates that the housing stock in the U.S. is aging.

American Housing Survey: 2020, 2021 Benefited Homeowners, Challenged Renters
In general, 2020 and 2021 were good years for homeowners but challenging years for many renters, HUD and the Census Bureau said in the annual American Housing Survey.
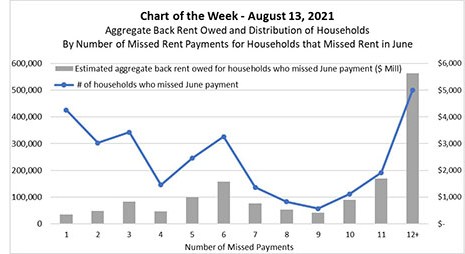
MBA Chart of the Week Aug. 16 2021–Aggregate Back Rent Owed
This week’s MBA Chart of the Week zeroes in on households who missed rental payments in June. The chart plots a) the distribution of those households by the number of payments they have missed since the onset of the pandemic; and b) an estimate of the aggregate dollar volume of back rent owed by those households.
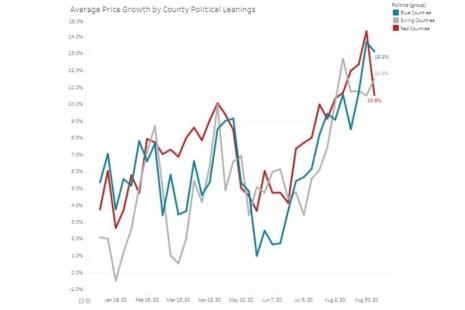
Monday Report: Red-Hot Housing Markets and a Time-Capsule Survey
This morning’s Monday Report features stories that confirm the housing markets remain hot, regardless of location or political preference; what that might mean for down payments; and a housing survey that, thanks to the coronavirus pandemic, was obsolete the moment it was released.