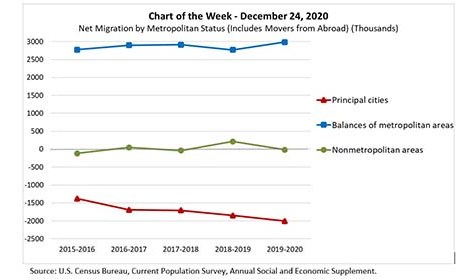
This week’s MBA Chart of the Week shows net migration by metropolitan status over the past five years. The green line shows that the net movement into nonmetropolitan areas has hovered around zero, growing by an average of 19,000 migrants (nationally). On the other hand, metropolitan areas absorbed more than 5.7 million migrants over this period.
Category: News and Trends
Joe Zeibert: Leveraging Right Data Analytics Can Make All the Difference
Leveraging the right data analytics can provide today’s mortgage companies with many competitive advantages and allow them to better support their LOs – letting them focus on what they do best and maximizing both customer satisfaction and revenue.
Housing Market Roundup, Jan. 4, 2021
We hope you had an enjoyable holiday break. Here is a summary of some reports that came out over the holidays:
ATTOM: Homeownership Slips into ‘Unaffordable’ in 4Q
ATTOM Data Solutions, Irvine, Calif., said median home prices of single-family homes and condos in the fourth quarter of 2020 were less affordable than historical averages in 55 percent of counties with enough data to analyze, up from 43 percent a year ago and 33 percent three years ago.

November Pending Home Sales Slide 2.6%
Ongoing inventory shortages and rising home prices pushed pending home sales down for the third straight month, the National Association of Realtors reported last week.
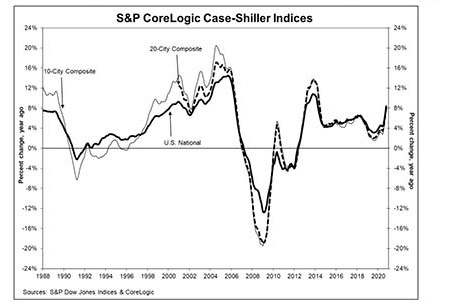
Home Price Strength Remains Strong
Standard & Poor’s, New York, last week reported its S&P CoreLogic Case-Shiller Index showed home prices posted continued strong growth year over year and month over month.

Institutions Increase Commercial Real Estate Allocations
COVID-19 has not dampened global institutions’ confidence in commercial real estate.
Servicing View from the C-Suite: A Conversation with Gwen Muse-Evans
MBA NewsLink interviewed GME Enterprises President and CEO Gwen Muse-Evans about mortgage servicing during a pandemic.
Dealmaker: JLL Income Property Trust Acquires Industrial Asset for $62M
JLL Income Property Trust, Chicago, acquired a Class A industrial portfolio in Indianapolis for $62 million.

The Week Ahead—Jan. 4, 2021
Good morning and Happy New Year! It won’t take long for us to find out if 2021 is a welcome respite from the chaos of 2020, or if its first words are “hold my beer.”