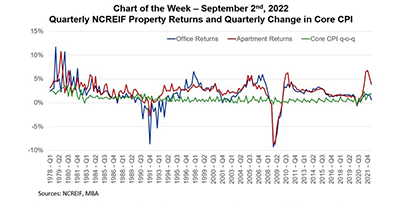
Federal Reserve Board Chair Jerome Powell warned at Jackson Hole, Wyo., last month, “Inflation is running well above 2 percent, and high inflation has continued to spread through the economy. While the lower inflation readings for July are welcome, a single month’s improvement falls far short of what the Committee will need to see before we are confident that inflation is moving down.”
Tag: MBA Chart of the Week
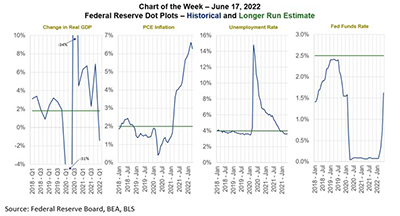
MBA Chart of the Week: Federal Reserve Projections
The Federal Reserve is racing to catch up to economic events, announcing a 75-basis-point increase in the federal funds rate and signaling more increases following last week’s FOMC meeting.
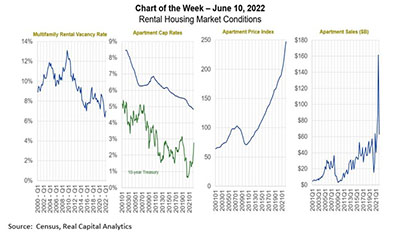
MBA Chart of the Week: Rental Housing Market Conditions
Commercial and multifamily real estate – after years of strong and steady growth – is in a period of transition, driven by changes in the space, equity and debt markets.
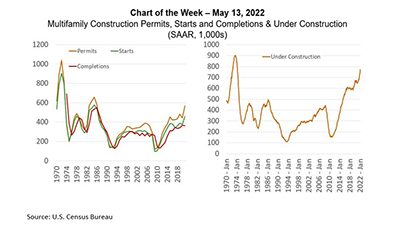
MBA Chart of the Week: Multifamily Construction
Housing markets are tight. Multifamily developers are responding.
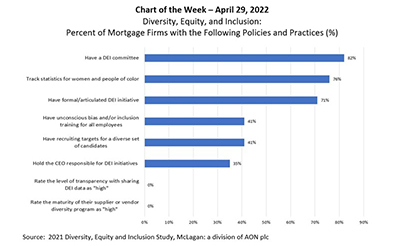
MBA Chart of the Week: Diversity, Equity and Inclusion
According to the inaugural 2021 Diversity, Equity and Inclusion Study, conducted by McLagan and recommended by Mortgage Bankers Association, participating mortgage firms – both residential and commercial/multifamily – had varied policies, practices and initiatives to further racial and gender equality within their organizations.
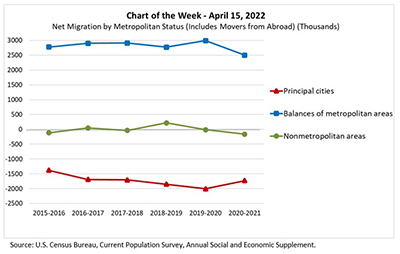
MBA Chart of the Week: Net Migration by Metropolitan Status
The Current Population Survey, sponsored jointly by the U.S. Census Bureau and the U.S. Bureau of Labor Statistics, includes an Annual Social and Economic Supplement conducted every March. The ASEC provides details on geographic mobility and migration over the last year—including information on the types of moves and the characteristics of the movers.
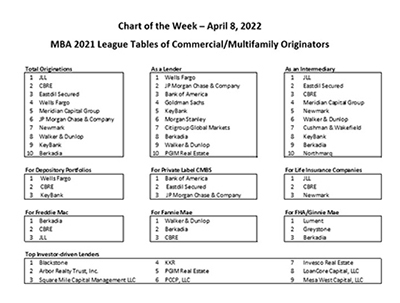
MBA Chart of the Week: Top Commercial/Multifamily Originators
MBA’s Commercial Real Estate/Multifamily Finance Firms – Annual Origination Volumes annual report presents a comprehensive set of listings of commercial/multifamily mortgage originators, their volumes and the different roles they play. The report presents origination volumes in more than 140 categories, including by role, by investor group, by property type, by financing structure type and by location of the originating office.
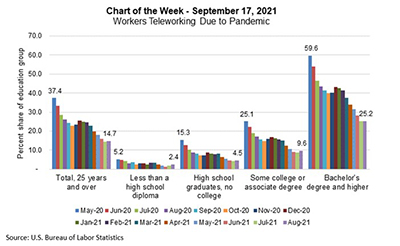
MBA Chart of the Week: Teleworking Due to Pandemic
The COVID-19 pandemic has forced many businesses to change the way they operate, and even 18 months later, there are different views and strategies for the workplace, with teleworking at the center of many discussions.
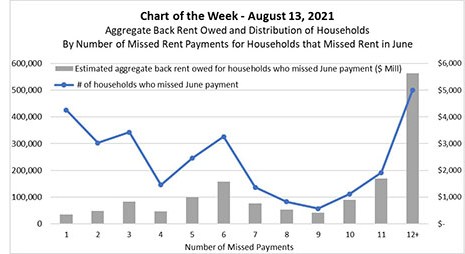
MBA Chart of the Week: Aggregate Back Rent Owed
The Research Institute for Housing America, MBA’s think tank, recently released updated second-quarter 2021 results that allow us to assess how renters, mortgagors and student loan borrowers fared over the first 15 months of the pandemic.
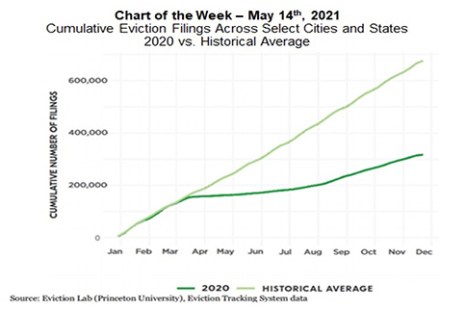
MBA Chart of the Week: Cumulative Eviction Filings, 2020 Vs. Historical Average
On May 5, U.S. District Court Judge Dabney Friedrich issued an order vacating the U.S. Centers for Disease Control and Prevention’s national eviction moratorium, but also put a temporary pause on the order, meaning that (as of this writing) the CDC moratorium, which is scheduled to expire on June 30, remains in place. A number of state-level bans also remain.