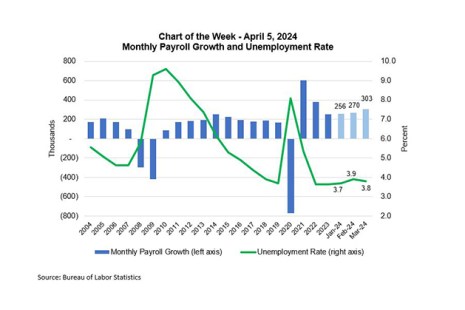
Our Chart of the Week focuses on Friday’s Employment Situation report released by the Bureau of Labor Statistics.
Tag: Chart of the Week
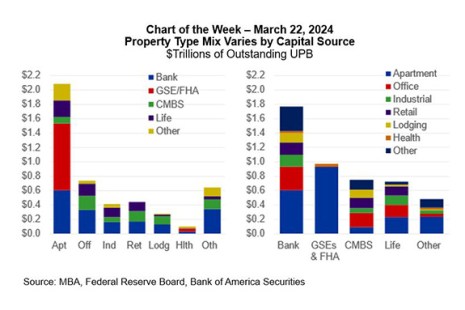
MBA Chart of the Week: CRE Mortgage Debt Across Capital Sources, Property Types
This week’s Chart of the Week shows MBA’s estimates of the distribution of CRE mortgage debt across capital sources and property types and is derived from a variety of public and private sources.
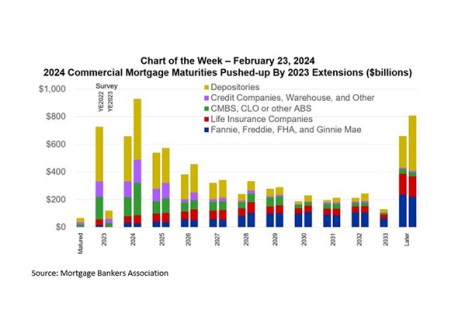
MBA Chart of the Week: 2024 Commercial Mortgage Maturities Pushed Up by 2023 Extensions
Commercial mortgages tend to be relatively long-lived, spreading maturities out over several years.
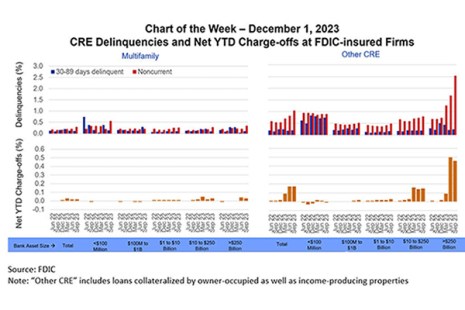
MBA Chart of the Week: CRE Delinquencies and Net YTD Charge-offs at FDIC-Insured Firms
Since March 2023, a recurring set of questions has revolved around a) how conditions in commercial real estate are affecting banks and b) how conditions with banks are affecting CRE.

MBA Chart of the Week: Actual and Modeled CRE Lending ($Billions)
MBA’s latest commercial real estate finance (CREF) forecast anticipates 2023 origination volumes ($442 billion) will come in just a bit more than half of what they were in 2022 ($816 billion).
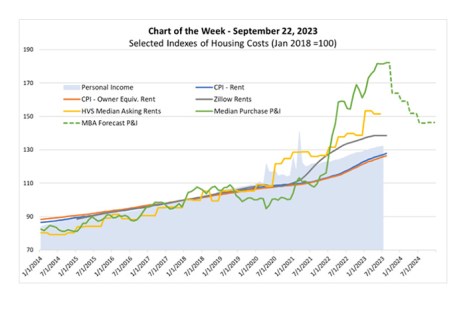
MBA Chart of the Week: Selected Indexes of Housing Costs
The monthly cost burden of purchasing a new home, as interest rates and house prices rose precipitously in 2022, continued in the first few months of 2023. For example, MBA’s Purchase Applications Payment Index (PAPI), hit a new high in May. Since then, despite 30-year mortgage interest rates eclipsing 7%, the index has come down slightly as median loan application amounts moderated. We are, however, still in record territory as shown by the solid green line in this week’s chart.
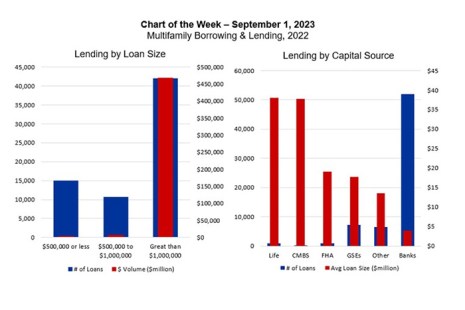
MBA Chart of the Week: Multifamily Borrowing and Lending, 2022
With more than $4.5 trillion of mortgage debt outstanding, commercial real estate finance markets are large and diverse.
MBA Chart of the Week: Year-to-Date Returns for REIT Stocks
How the health, social and economic impacts of the coronavirus outbreak flow through to commercial and multifamily properties remains clouded in uncertainty – mainly because of the uncertainty about the virus itself and our public and private responses to it. One thing that is clear is that different property types and different markets will be affected differently.
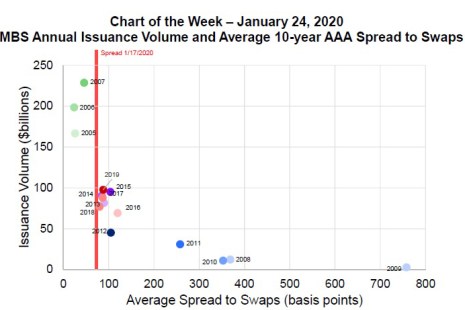
MBA Chart of the Week: CMBS Annual Issuance Volume
After a slow start in 2019, the commercial mortgage-backed securities market ended strong, with $39.1 billion of private-label CMBS issuance during the fourth quarter – more than double the $18.8 …