
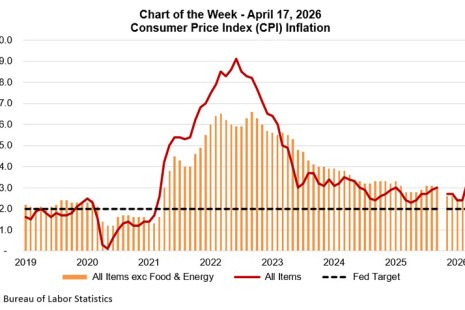
The impact of the war in Iran and the disruption of shipping routes through the Strait of Hormuz has pushed inflation to the forefront of economic concerns.
Tag: Chart of the Week

Chart of the Week: Commercial Mortgage Delinquency Rates, Range Since 1996
According to the Mortgage Bankers Association’s latest Commercial Delinquency Report, commercial mortgage delinquency rates were mixed across investor groups in the fourth quarter of 2025.
Chart of the Week: Monthly Payroll Growth and Unemployment Rates
In February 2026, with job losses in health care due to labor strikes, there was nothing left to support aggregate job growth, and total nonfarm payrolls declined by 92,000. Furthermore, job growth for December and January was revised down by a total of 69,000. Wage growth increased slightly to 3.8% over the past year.
Chart of the Week: Commercial Real Estate Loan Maturity Volumes
Seventeen percent ($875 billion) of the $5.0 trillion of outstanding commercial mortgages held by lenders and investors is scheduled to mature in 2026, a 9% decrease from the $957 billion that was scheduled to mature in 2025. This is according to the Mortgage Bankers Association’s 2025 Commercial Real Estate Survey of Loan Maturity Volumes.
Chart of the Week: Annual Change in PCE Inflation
While markets were eager for Friday’s report on Q4 2025 GDP, perhaps the most significant result was that PCE inflation increased 2.8% compared to a year ago, a reacceleration from the third quarter, with the core measure exhibiting a 2.9% increase.
MBA Chart of the Week: The Steepening of the Yield Curve in Multifamily Lending
The yield curve steepened significantly from the end of 2024 and through 2025. The Federal Reserve cut rates three times in 2025, leading to a decline in short-term rates while long-term rates remained elevated.
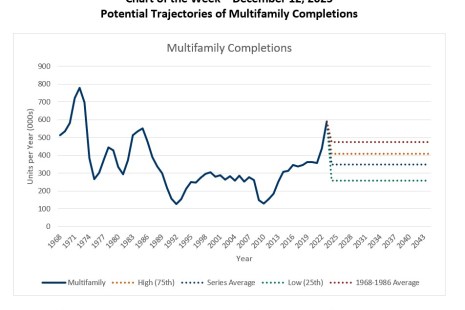
Chart of the Week: Potential Trajectories of Multifamily Completions
Developers have been building many apartment units over the past several years. We expect the pace of development to slow in the years ahead, given declining fundamentals including falling rents, rising vacancies, and increasing delinquencies in the multifamily sector (see MBA CREF Databook).
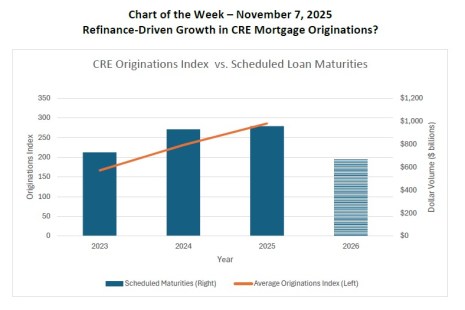
MBA Chart of the Week: Refinance-Driven Growth in CRE Mortgage Originations
This week’s Chart of the Week focuses on trends in commercial and multifamily originations, which saw a 36% increase year-over-year in the third quarter of 2025.

Chart of the Week: Multifamily Market Share by Capital Source
This Chart of the Week focuses on the distribution of the multifamily market share by capital source. The multifamily market is a fundamental part of the broader commercial real estate market, and originations have been strong throughout 2025. The figure reports MBA estimates of the shares of originations by each capital source, overlaid with total multifamily origination volumes.
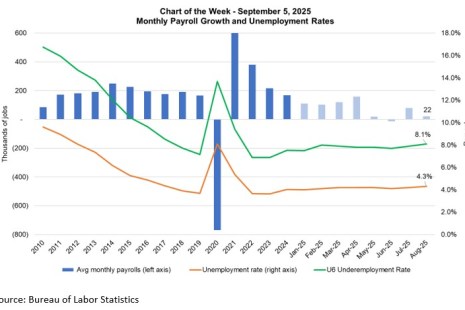
MBA Chart of the Week: Monthly Payroll Growth and Unemployment
Job growth slowed to just 22,000 jobs in August and estimates for the prior two months were revised down by 21,000.