
Commercial mortgage delinquencies increased across all major capital sources in the first quarter of 2025, according to the Mortgage Bankers Association’s (MBA) latest Commercial Delinquency Report. While overall delinquency rates remain relatively low by historical standards, the increases highlight growing stress in parts of the market, particularly in sectors facing refinancing challenges or weakened fundamentals.
Tag: Chart of the Week

Chart of the Week: Total Commercial Real Estate Lending
According to MBA’s Annual Origination Summation, from 2020 to 2024, commercial and multifamily mortgage originations experienced notable shifts across investor types. The market peaked in 2021, driven by heightened activity across nearly all sectors, before experiencing a sharp decline in 2023. A modest rebound followed in 2024.
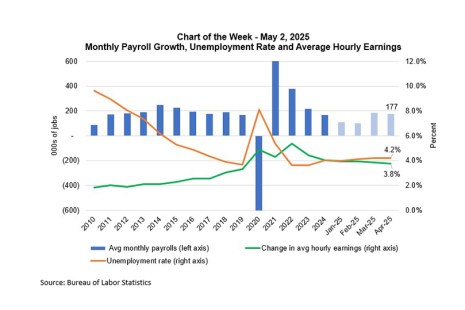
Chart of the Week: Monthly Payroll Growth, Unemployment Rate and Average Hourly Earnings
The April Employment Situation report showed that the job market continues to hold up. The pace of job growth slowed in April to a 177,000 gain, down from a downwardly revised 185,000 gain in March, but above the 152,000 average gain over the past 12 months.

Chart of the Week: Commercial and Multifamily Mortgage Debt Outstanding
According to MBA’s Quarterly Mortgage Debt Outstanding Report, total commercial and multifamily mortgage debt outstanding increased by 3.7% year-over-year, rising from $4.62 trillion in Q4 2023 to $4.79 trillion in Q4 2024. This growth reflects continued investment in commercial real estate, with sector-specific variations in debt allocation.
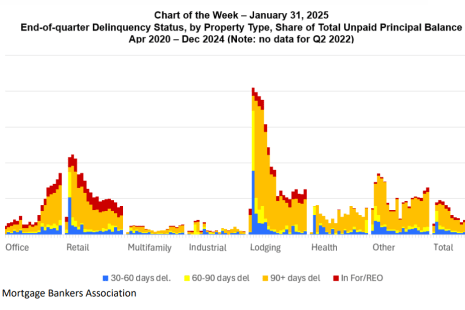
Chart of the Week: End-of-Quarter Delinquency Status, by Property Type, Share of Total Unpaid Principal Balance
Delinquency rates for commercial property mortgages increased in the fourth quarter of 2024, according to the Mortgage Bankers Association’s (MBA) latest Commercial Real Estate Finance (CREF) Loan Performance Survey.
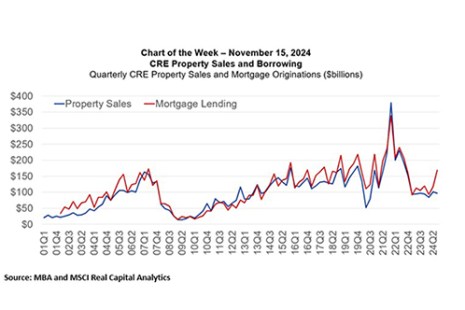
Chart of the Week: CRE Property Sales and Borrowing
After a slow start to this year, borrowing and lending backed by commercial real estate properties picked up during the third quarter. Originations increased 59% compared to a year ago and increased 44% from the second quarter of 2024.
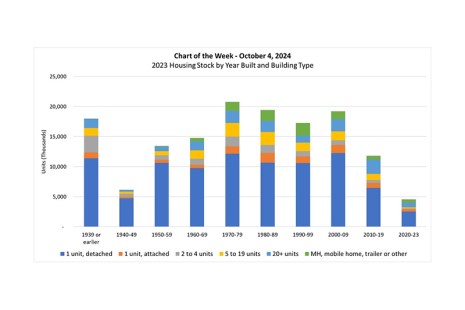
MBA Chart of the Week: 2023 Housing Stock by Year Built and Building Type
At the end of September 2024, the U.S. Department of Housing and Urban Development (HUD) and the U.S. Census Bureau released 2023 American Housing Survey (AHS) data.
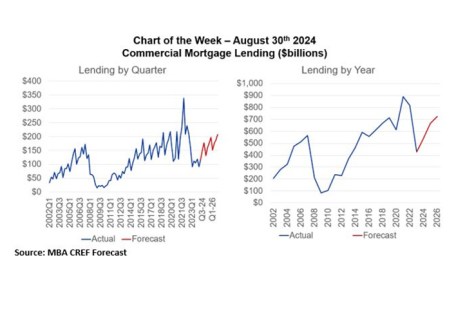
MBA Chart of the Week: Commercial Mortgage Lending
Is the logjam in CRE transaction activity starting to break?
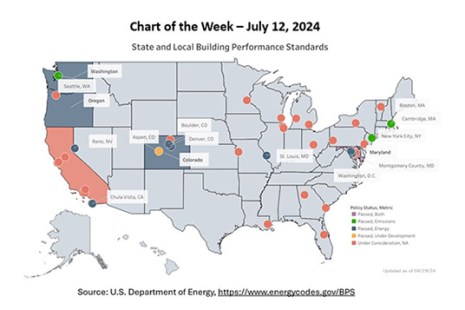
MBA Chart of the Week: State, Local Building Performance Standards
New York City has Local Law 97. Washington D.C. has its Building Energy Performance Standards (BEPS). Seattle has its Building Emissions Performance Standards (also BEPS). Denver has its Building Performance Policy (BPP).
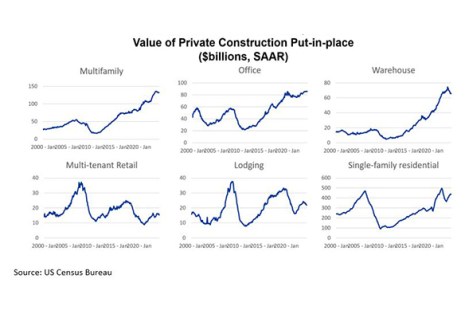
MBA Chart of the Week: Value of Private Construction Put-in-Place
Physicists have protons, neutrons, and electrons. Biologists have DNA and RNA. And economists have supply and demand — the building blocks upon which most of our understanding of markets rest.