Home Price Reports: ‘Deceleration’ is Key Word

Reports on Tuesday confirmed home price appreciation is slowing, although prices remain high by historical standards.
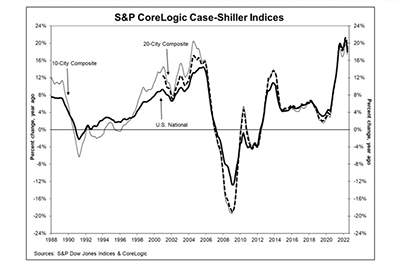
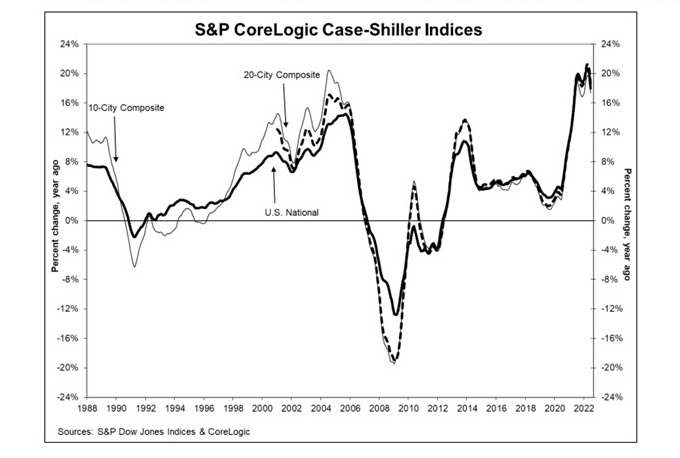
The S&P CoreLogic Case-Shiller Indices reported an 18 percent annual gain in June, still hot but well off the 19.9 percent pace in May. And the Federal Housing Finance Agency also reported deceleration in June, to 17 percent.

The S&P CoreLogic Case-Shiller U.S. National Home Price Index reported an 18.0% annual gain in June, down from 19.9% in May. The 10-City Composite annual increase came in at 17.4%, down from 19.1% in May. The 20-City Composite posted an 18.6% year-over-year gain, down from 20.5% in May.
Tampa led with a 35.0% year-over-year price increase, followed by Miami at 33.0% and Dallas in third at 28.2%. Only one of the 20 cities reported higher price increases in the year ending June versus the year ending May.
Month over month, before seasonal adjustment, the U.S. National Index posted an 0.6% increase in June, while the 10-City and 20-City Composites posted increases of 0.4%. After seasonal adjustment, the U.S. National Index posted a month-over-month increase of 0.3%, while the 10-City and 20-City Composites posted increases of 0.3% and 0.4%, respectively. Thirteen 13 cities reported increases before and after seasonal adjustments.
“The deceleration in U.S. housing prices that we began to observe several months ago continued in June,” said Craig J. Lazzara, Managing Director with S&P DJI. “We’ve noted previously that mortgage financing has become more expensive as the Federal Reserve ratchets up interest rates, a process that continued as our June data were gathered. As the macroeconomic environment continues to be challenging, home prices may well continue to decelerate.”
“The moderation in home prices is even greater than the headline suggests,” said Mark Vitner, Senior Economist with Wells Fargo Economics, Charlotte, N.C. “While the S&P/Case-Shiller index is reported monthly, the data actually reflect a trailing three-month moving average dating back to April. Discounting picked up considerably in May and June, and we expect home prices to moderate further in coming months.”
Vitner noted even with the moderation, housing affordability remains challenging. I”n nominal terms, home prices are currently 65.9% above the peak hit during the housing bubble a little over 15 years ago,” he said. “In real terms, after adjusted for the rise in the Consumer Price Index, prices are 12.3% above their prior peak. Prices have also risen relative to median income. Now that mortgage rates are nearing 6% again, we can expect some further moderating in home sales and more discounting by sellers and home builders.”
The report said average home prices for the MSAs within the 10-City and 20-City Composites are exceeding their winter 2007 levels.
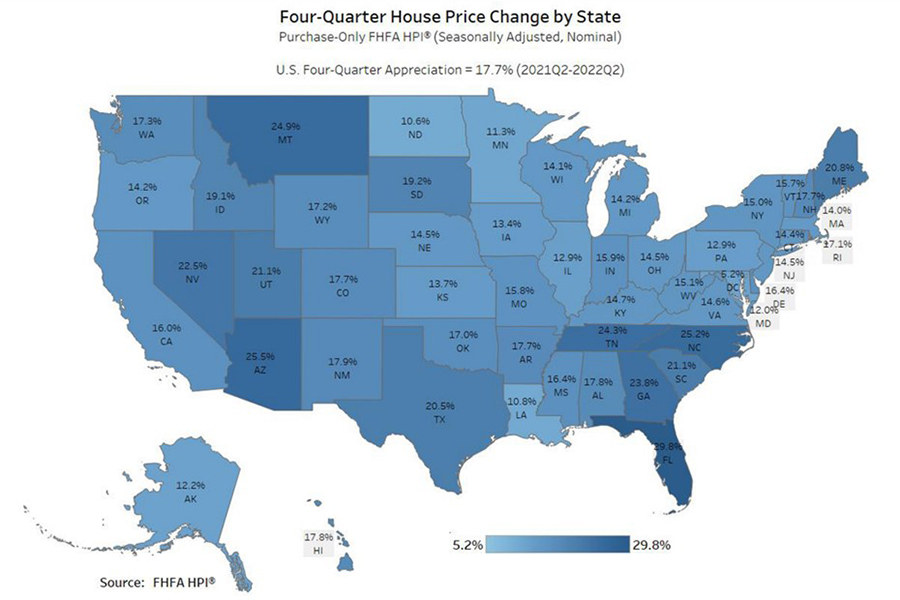
Meanwhile, the FHFA House Price Index reported U.S. house prices rose by 17.7 percent annually through the second quarter and by 4.0 percent compared to the first quarter. The FHFA seasonally adjusted monthly index for June rose by 0.1 percent from May.

“Housing prices grew quickly through most of the second quarter of 2022, but a deceleration has appeared in the June monthly data,” said William Doerner, Supervisory Economist in FHFA’s Division of Research and Statistics. “The pace of growth has subsided recently, which is consistent with other recent housing data.”
Nationally, the U.S. housing market has experienced positive annual appreciation each quarter since the start of 2012.
The report said house prices rose in all 50 states and the District of Columbia between the second quarters annually, with highest annual appreciation in Florida, 29.8 percent; Arizona, 25.5 percent; North Carolina, 25.2 percent; Montana, 24.9 percent; and Tennessee, 24.3 percent. areas showing the lowest annual appreciation were 1) District of Columbia 5.2 percent; 2) North Dakota 10.6 percent; 3) Louisiana 10.8 percent; 4) Minnesota 11.3 percent and 5) Maryland 12.0 percent.
FHFA said house prices rose in all 100 largest metropolitan areas over the past four quarters. Annual price increases were greatest in North Port-Sarasota-Bradenton, Fla., where prices increased by 36.4 percent. Prices were weakest in Washington-Arlington-Alexandria, DC-VA-MD-WV, where they increased by 9.1 percent.
