MBA Chart of the Week Apr. 15, 2022: Net Migration by Metropolitan Status

The Current Population Survey, sponsored jointly by the U.S. Census Bureau and the U.S. Bureau of Labor Statistics, includes an Annual Social and Economic Supplement conducted every March. The ASEC provides details on geographic mobility and migration over the last year—including information on the types of moves and the characteristics of the movers.
For example, the 2021 ASEC reported that 27.1 million Americans reported living at a different residence than in 2020. Down from 29.8 million between spring 2019 and spring 2020, the 2021 ASEC data represents an 8.4% mover rate—the lowest rate in over 70 years.

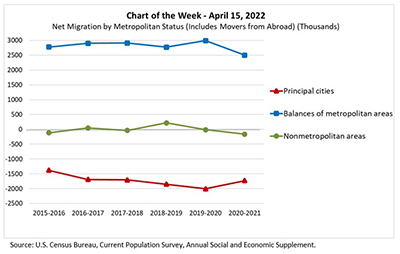
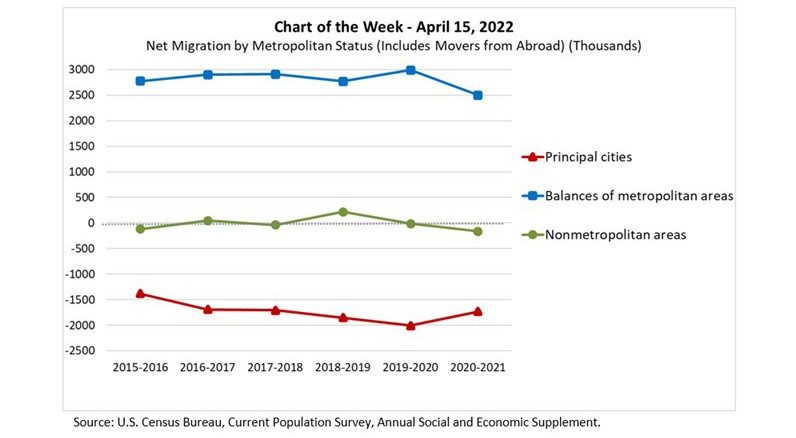
This week’s MBA Chart of the Week shows net migration by metropolitan status from spring 2015 to spring 2021. The most recent 2020-2021 data allows us to examine moves during the first year of the pandemic, and to see if, as widely reported, there was accelerated movement out of cities to the suburbs (or even further afield) compared to the five years prior to COVID-19.
Prior to the pandemic, metropolitan area principal cities experienced an accelerating net out-migration (red line), with over 2 million more people moving out than moving in in the year prior to the pandemic. The trend of accelerating out-migration reversed in 2020-2021, with a slightly slower rate of 1.7 million people leaving principal cities.
Furthermore, while 316,000 more people ages 25-29 left than moved into principal cities in 2019-2020, the comparable number halved to 164,000 in 2020-2021. On the other hand, the net out-migration from principal cities for individuals ages 30-34 increased from 178,000 in 2019-2020 to 207,000 in 2020-2021, and the net out-migration for the 35-39 age group was down slightly (from 155,000 to 148,000).
The trend of out-migration from principal cities reflects many factors, including the main mass of millennials reaching prime first-time homebuyer age. MBA Research will continue to monitor and report on these trends, as well as changes in the overall U.S. population, as updated data becomes available.
–Edward Seiler eseiler@mba.org.
