
The delayed report released Dec. 16 by the Bureau of Labor Statistics showed 64,000 jobs were added in November, with the unemployment rate up slightly to 4.6%.
Tag: Unemployment

Jobs Up by 22,000 in August, Unemployment at 4.3%, BLS Reports
The Bureau of Labor Statistics released August jobs data Friday morning, finding that total nonfarm payroll employment ticked up by 22,000, and the unemployment rate is little changed at 4.3%.
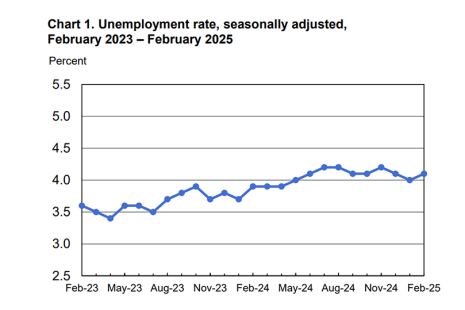
Jobs Up by 151,000 in February; Unemployment Rate Ticks Up
The Bureau of Labor Statistics released February employment numbers, finding total nonfarm payroll rose by 151,000 in February.
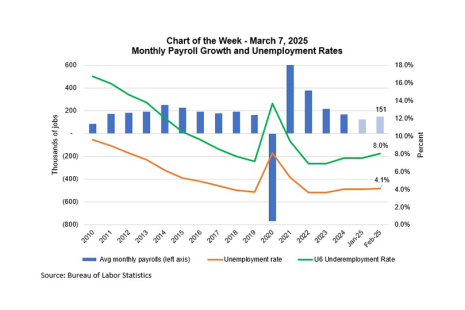
MBA Chart of the Week: Monthly Payroll Growth, Unemployment Rates
The job market softened somewhat in February, with the unemployment rate increasing to 4.1%, the pace of private sector job growth up by 140,000, and wage growth steady at 4%.

143,000 Jobs Added in January, Unemployment Rate Edges Down
There were 143,000 jobs added to total nonfarm payroll employment in January, the Bureau of Labor Statistics reported Feb. 7.

Jobs Grow by More Than 250,000 in December; Industry Economists Weigh In
Total nonfarm payroll employment grew by 256,000 in December, and the unemployment rate was little changed at 4.1%, the U.S. Bureau of Labor Statistics reported.

Chart of the Week: Unemployment by Duration
Based on the November 2024 jobs report, the unemployment rate is above 4.2%, the household survey again showed a large drop in employment, and more households reported spells of long-term unemployment, which is typically defined as being unemployed for 27 weeks or more.
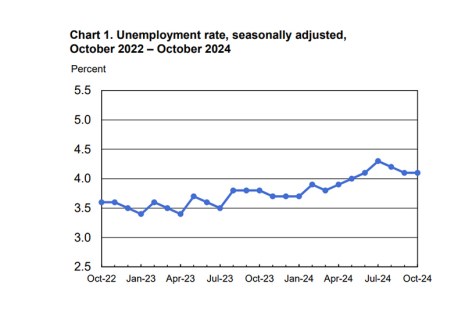
BLS: Jobs Close to Flat in October
Total nonfarm payroll inched up by just 12,000 in October, and the unemployment rate was unchanged at 4.1%, per the U.S. Bureau of Labor Statistics.

Chart of the Week: Payroll Growth and Unemployment Rate
The August employment report confirmed that the job market is cooling. With a 142,000 job increase in August and downward revisions of the June and July numbers, job growth has slowed to an average of 116,000 jobs over the past three months.
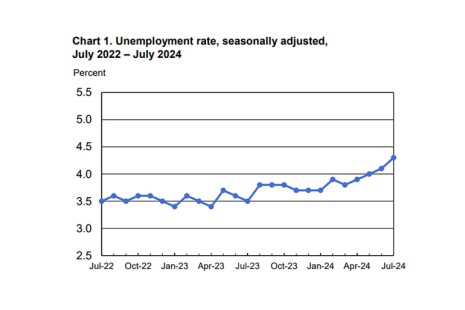
Unemployment Rises to 4.3% in July
Total nonfarm payroll increased by 114,000 in July, per the U.S. Bureau of Labor Statistics.