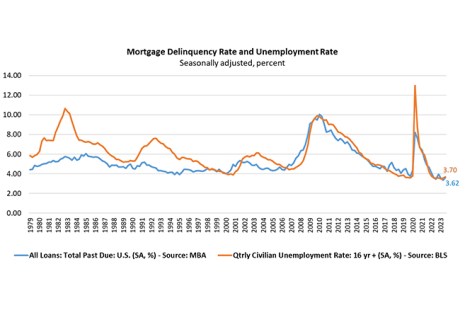
According to the latest MBA National Delinquency Survey, the overall delinquency rate for mortgage loans on one‐to‐four‐unit residential properties increased to 3.62% of all loans outstanding at the end of the third quarter of 2023.
Tag: MBA Chart of the Week
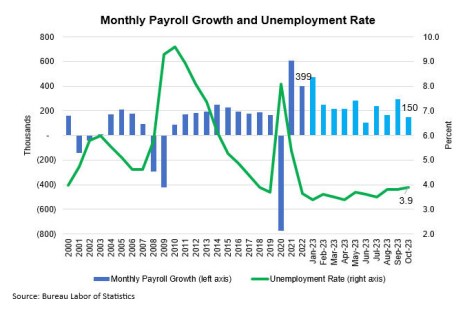
MBA Chart of the Week: Monthly Payroll Growth and Unemployment Rate
This week’s Chart of the Week highlights the October Employment Situation results released Friday.
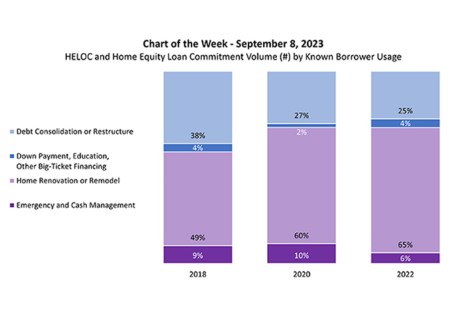
MBA Chart of the Week: HELOC and Home Equity Loan Commitment Volume
Dollar volume of open-end home equity lines of credit (HELOCs) and closed-end home equity loans originated in 2022 increased 50 percent compared to 2020, driven by home renovation or remodeling, according to MBA’s latest Home Equity Lending Study. This week’s Chart of the Week explores the known reasons that borrowers take out a HELOC or home equity loan, according to participants in our study.
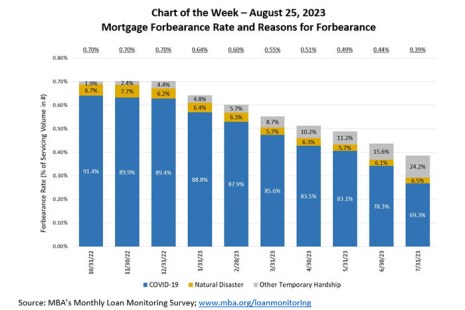
MBA Chart of the Week Aug. 28: Mortgage Forbearance Rate and Reasons for Forbearance
According to the July results from MBA’s Monthly Loan Monitoring Survey, the total number of loans now in forbearance decreased by 5 basis points from 0.44% of servicers’ portfolio volume in the prior month to 0.39% as of July 31, 2023.
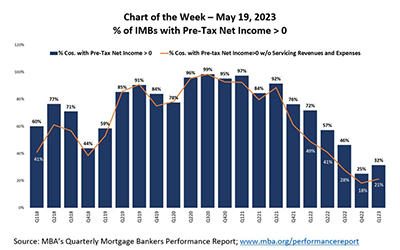
MBA Chart of the Week May 19, 2023: % of IMBs with Pre-Tax Net Income
Today’s Chart of the Week compares the percentage of companies in the QPR that reported positive pre-tax net income including all lines of business (e.g. production and servicing operations), versus the percentage of companies that reported positive pre-tax net income, once servicing operations are excluded.
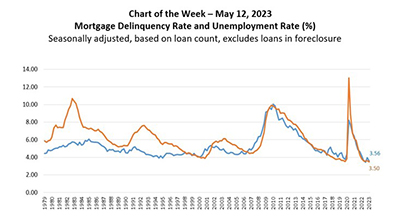
MBA Chart of the Week May 12, 2023: Mortgage Delinquency Rate, Unemployment Rate
This week’s chart shows that mortgage delinquencies and the unemployment rate continue to track each other closely.
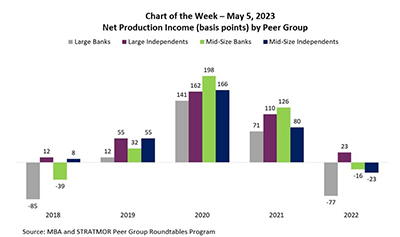
MBA Chart of the Week May 5, 2023: Net Production Income by Peer Group
In this week’s MBA Chart of the Week, we look at pre-tax net production income from a different source – the MBA and STRATMOR Peer Group Roundtables Program.
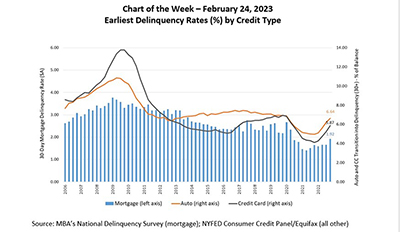
MBA Chart of the Week Feb. 24 2023–Delinquency Rates by Credit Type
The latest credit delinquency data from both MBA and other sources indicates that delinquencies are rising. In MBA’s National Delinquency Survey, covering national and state delinquencies through the fourth quarter revealed that the delinquency rate for mortgage loans on one‐to‐four‐unit residential properties rose to a seasonally adjusted rate of 4.96 percent of all loans outstanding at the end of the fourth quarter.
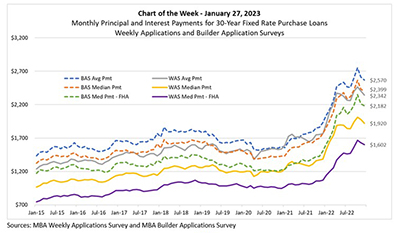
MBA Chart of the Week, Jan. 27, 2023: Monthly Principal, Interest Payments
In the most recent MBA Purchase Applications Payment Index (PAPI) release, MBA Research introduced a new measure—The Builders’ Purchase Applications Payment Index (BPAPI). While PAPI uses MBA’s Weekly Applications Survey purchase data to calculate mortgage payments, BPAPI uses analogous MBA Builder Applications Survey data to create an index that measures how new mortgage payments vary across time relative to income, with a focus exclusively on newly built single-family homes.
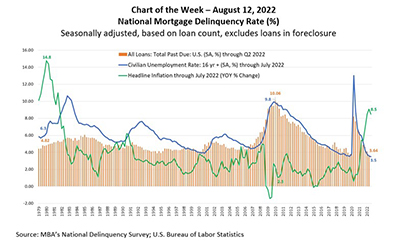
MBA Chart of the Week, Aug. 12, 2022: National Mortgage Delinquency Rate
This week’s MBA Chart of the Week highlights the relationship between MBA’s mortgage delinquency rate and two economic indicators, the unemployment rate, and year-over-year changes in headline inflation – measuring the price of goods and services in the economy.

