
Commercial mortgage delinquencies increased across all major capital sources in the first quarter of 2025, according to the Mortgage Bankers Association’s (MBA) latest Commercial Delinquency Report. While overall delinquency rates remain relatively low by historical standards, the increases highlight growing stress in parts of the market, particularly in sectors facing refinancing challenges or weakened fundamentals.
Tag: Chart of the Week
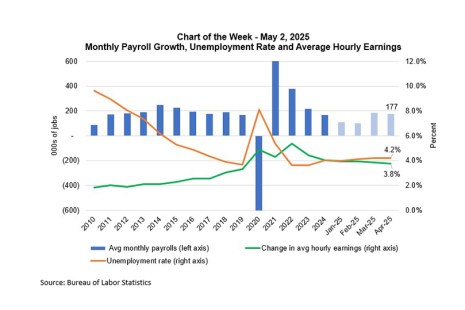
Chart of the Week: Monthly Payroll Growth, Unemployment Rate and Average Hourly Earnings
The April Employment Situation report showed that the job market continues to hold up.

Chart of the Week: MOVE Volatility Index and Mortgage-Treasury Spread
Market volatility, both in equity and bond markets, increased sharply this week because of the serial surprises with respect to the direction of U.S. tariff policy.

Chart of the Week: Effect of 2025 Announced Tariffs on Household Disposable Income
Since World War II, the consensus among economists has been pro-free trade with the attitude to tariffs summed up by JP Morgan’s David Kelly: “The trouble with tariffs, to be succinct, is that they raise prices, slow economic growth, cut profits, increase unemployment, worsen inequality, diminish productivity, and increase global tensions. Other than that, they’re fine.”

Chart of the Week: Commercial and Multifamily Mortgage Debt Outstanding
According to MBA’s Quarterly Mortgage Debt Outstanding Report, total commercial and multifamily mortgage debt outstanding increased by 3.7% year-over-year, rising from $4.62 trillion in Q4 2023 to $4.79 trillion in Q4 2024. This growth reflects continued investment in commercial real estate, with sector-specific variations in debt allocation.
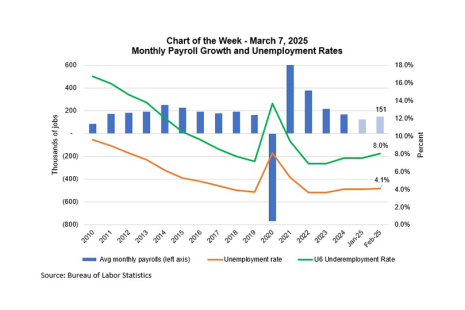
MBA Chart of the Week: Monthly Payroll Growth, Unemployment Rates
The job market softened somewhat in February, with the unemployment rate increasing to 4.1%, the pace of private sector job growth up by 140,000, and wage growth steady at 4%.

MBA Chart of the Week: CRE Loan Maturity Volumes
Twenty percent ($957 billion) of $4.8 trillion of outstanding commercial mortgages held by lenders and investors will mature in 2025, a 3% increase from the $929 billion that matured in 2024, according to the Mortgage Bankers Association’s 2024 Commercial Real Estate Survey of Loan Maturity Volumes.
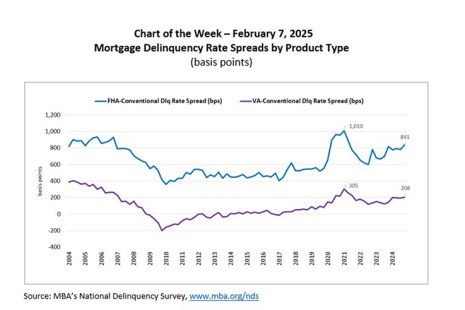
Chart of the Week: Mortgage Delinquency Rate Spreads by Product Type
According to the latest results from MBA’s National Delinquency Survey (NDS), the overall delinquency rate for mortgage loans on one‐to‐four‐unit residential properties increased to a seasonally adjusted rate of 3.98 percent of all loans outstanding at the end of the fourth quarter of 2024.
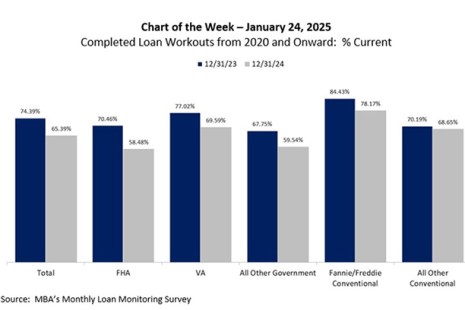
Chart of the Week: Completed Loan Workouts from 2020 Onward
According to the latest results from MBA’s Monthly Loan Monitoring Survey, approximately 235,000 homeowners are in forbearance plans as of December 31, 2024. This level is substantially lower than the peak of almost 4.3 million homeowners in June 2020 and the 8.5 million borrowers who have been provided forbearance since March 2020.

Chart of the Week: Unemployment by Duration
Based on the November 2024 jobs report, the unemployment rate is above 4.2%, the household survey again showed a large drop in employment, and more households reported spells of long-term unemployment, which is typically defined as being unemployed for 27 weeks or more.