MBA White Paper Measures the Impact of Loan Sizes on Profitability Through Mortgage Cycles

The conventional wisdom is that originating and servicing higher balance loans means higher profits. However, according to a new white paper by the Mortgage Bankers Association titled, How do Mortgage Revenues, Costs and Profitability Vary by Loan Balance? An Analysis Using Benchmarking Data, the relationship between loan balance and profitability is more nuanced and may change over the course of market cycles.
“In recent years, housing inventory constraints and home-price appreciation have resulted in rising average loan balances for single-family homeownership. Yet, financing lower balance loans is an essential way for the mortgage industry to facilitate access to affordable, lower-valued homes,” said MBA’s Vice President of Industry Analysis Marina Walsh, CMB.
In a December 2022 comment letter to the Federal Housing Administration (FHA), MBA cited cost barriers and regulatory barriers as the primary reasons for the dearth in small-dollar lending.[1]
“The cost barrier argument suggests that the revenues garnered through originating lower balance loans do not justify the costs. But how much does loan size impact lender and servicer profitability? Do lenders originating higher balance loans always generate higher profits?” questioned Walsh. “Using multiple MBA proprietary benchmarking data sources, our white paper examines the impact of loan size on production and servicing revenues, costs, and overall profitability across market cycles.”
Key Findings of MBA’s Loan Balance White Paper:
• For originating high balance loans versus low balance loans, based on MBA’s analysis of both banks and independent mortgage companies (IMBs) combined:
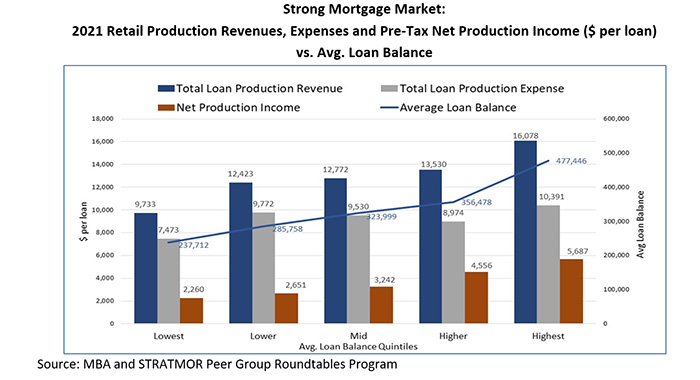
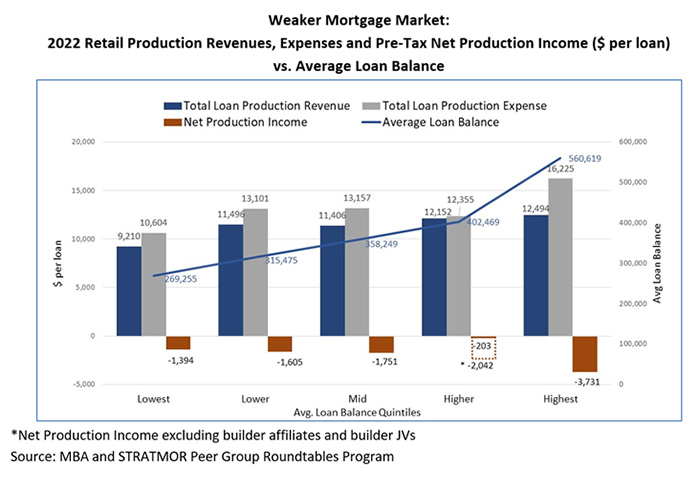
– Companies with the highest loan balances (averaging over $560,000 in 2022) experienced the highest of highs for net production profits in 2021 (a strong market) and the lowest of lows last year (a weak market).
– Companies with the lowest loan balances (averaging less than $269,255 in 2022) performed the worst in 2021 compared to lenders with higher loan balances, because lower revenues hurt net profits, despite cost advantages. However, in 2022, through lower fixed and variable costs, companies with the lowest loan balances also mitigated net production losses to a greater extent than higher balance lenders.


• For servicing high balance loans versus low balance loans, based on MBA’s analysis of both banks and IMBs combined:
– Net servicing operating income[2] generally increased as loan balances rose because the revenue gains outweighed incremental cost increases when moving from lower to higher balance servicers. This was consistent across a high prepayment and low prepayment cycle.
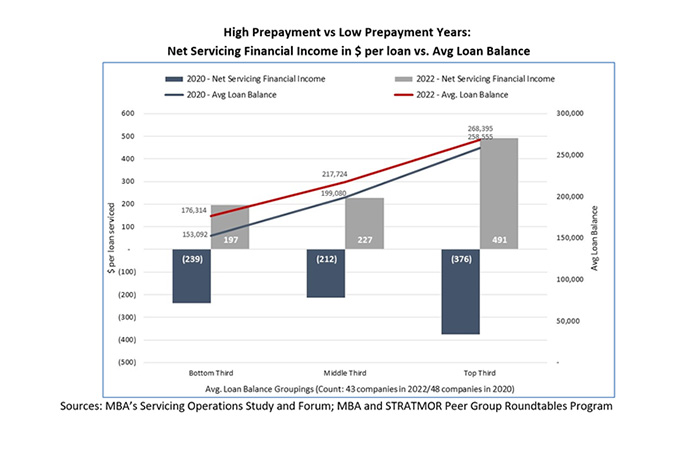
– Net servicing financial income[3] differed depending on the market cycle. Servicers with the highest loan balances posted the highest net servicing financial income compared to servicers with lower loan balances in 2022, when there was low prepayment activity. However, servicers with higher loan balances posted the lowest net servicing financial income in 2020–a period of high prepayment activity.
MBA’s analysis spans various benchmarking studies, including an independent company-only sample that presents mixed results. For a full copy of the report, click here.
[1] See MBA’s December 2022 letter in response to FHA’s RFI regarding small mortgage lending. Available at: https://www.mba.org/industry-resources/resource/mba-letter-to-fha-on-small-mortgage-lending-rfi.
[2] Net servicing income includes servicing fees, late fees, other ancillary fees and net escrow earnings less the sum of direct servicing expenses, unreimbursed foreclosure and REO costs, and corporate allocations.
[3] Net servicing financial income includes net servicing income (as defined above) plus – which includes net operating income plus: gains/losses on the valuation of mortgage servicing rights (MSRs); MSR hedging gains/losses; gains/losses on the sale of MSRs; and amortization/loan decay of MSRs.
