
MBA President and CEO Bob Broeksmit, CMB, testified at a legislative hearing titled, “Prioritizing Main Street: Evaluating the Impact of Capital Proposals on Economic Growth and American Communities,” before the House Financial Services Committee.
Tag: Warehouse Lines of Credit
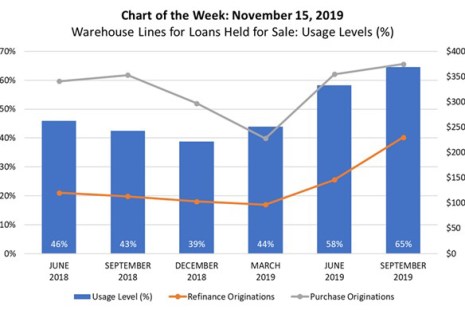
MBA Chart of the Week: Warehouse Lines for Loans Held for Sale
This week’s chart plots quarter-end average warehouse usage levels from inception of the MBA Warehouse Lending Survey in June 2018 through September 2019. It further compares these usage levels to MBA estimates of purchase and refinance origination volume for the respective quarters.