This week’s MBA Chart of the Week zeroes in on selected payment and employment characteristics of households who made and missed their rent and mortgage payments in September.
Tag: Understanding America Study
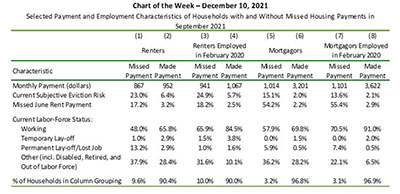
MBA Chart of the Week: Payment & Employment Characteristics
This week’s MBA Chart of the Week zeroes in on selected payment and employment characteristics of households who made and missed their rent and mortgage payments in September.
RIHA: More Renters, Fewer Homeowners Missed Housing Payments in September, October
Renters were three times more likely than homeowners to miss payments during September and October, according to updated research released Tuesday by the Mortgage Bankers Association’s Research Institute for Housing America.
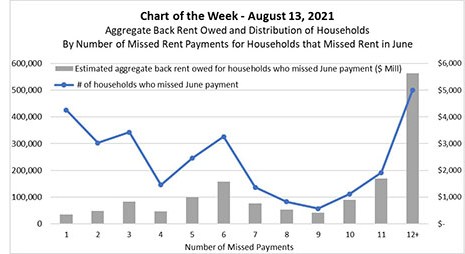
MBA Chart of the Week Aug. 16 2021–Aggregate Back Rent Owed
This week’s MBA Chart of the Week zeroes in on households who missed rental payments in June. The chart plots a) the distribution of those households by the number of payments they have missed since the onset of the pandemic; and b) an estimate of the aggregate dollar volume of back rent owed by those households.
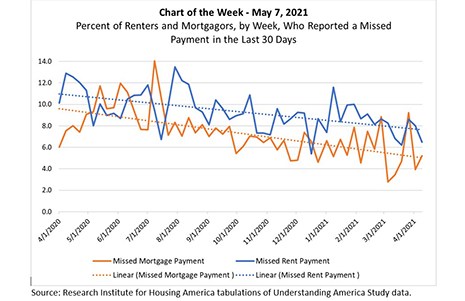
MBA Chart of the Week, May 7, 2021: Renters/Mortgagors & Missed Payments
The Research Institute for Housing America, MBA’s think tank, released updated first-quarter results that allow us to assess how renters, mortgagors and student loan borrowers fared over the first 12 months of the COVID-19 pandemic.
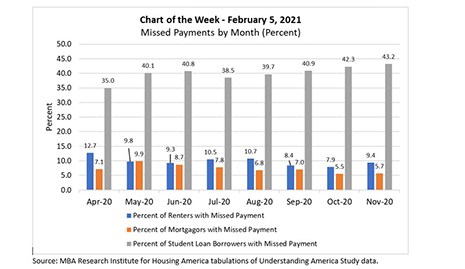
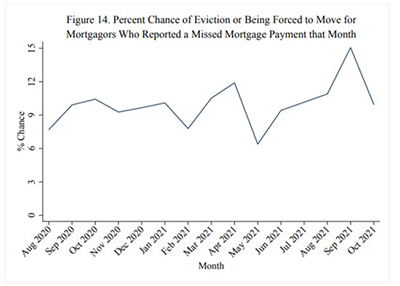
MBA Chart of the Week: Missed Payments By Month (Percent)
This week’s MBA Chart of the Week chart provides a preview of newly updated pandemic-related household financial insights that MBA’s Research Institute for Housing America released this morning, Feb. 8.
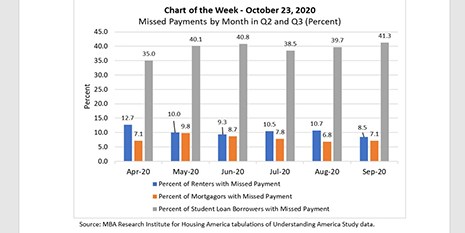
MBA Chart of the Week: Missed Payments By Month (Q2-Q3)
This week’s MBA Chart of the Week chart provides fresh third quarter 2020 insights on the Research Institute for Housing America’s special report released in September that highlighted household financial distress during the second quarter—the first three months of the pandemic.
RIHA Study: More than 6 Million Renters and Homeowners and 26 Million Student Debt Borrowers Missed September Payment
More than six million households did not make their rent or mortgage payments, and 26 million individuals missed their student loan payment in September, according to third quarter research released today by the Mortgage Bankers Association’s Research Institute for Housing America.