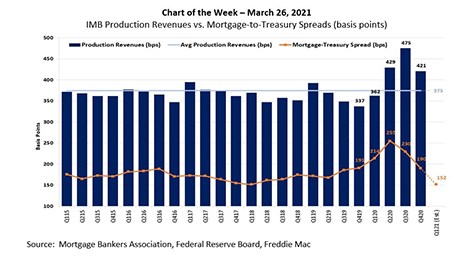
In this Chart of the Week, we compare in basis points the average quarterly credit spreads between the 30‐year mortgage rate (as surveyed by Freddie Mac) and the 10‐year Treasury yield to production revenues (fee income, secondary marketing income and warehouse spread).

