Commercial and multifamily mortgage loan originations increased by 119 percent in the third quarter from a year ago and increased by 19 percent from the second quarter, the Mortgage Bankers Association’s Quarterly Survey of Commercial/Multifamily Mortgage Bankers Originations reported.
Tag: Jamie Woodwell
MBA: 3Q Commercial/Multifamily Borrowing Jumps Nearly 120% Year over Year
Commercial and multifamily mortgage loan originations increased by 119 percent in the third quarter from a year ago and increased by 19 percent from the second quarter, the Mortgage Bankers Association’s Quarterly Survey of Commercial/Multifamily Mortgage Bankers Originations reported.
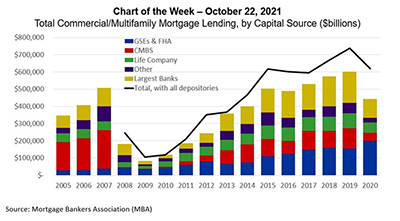
MBA Chart of the Week Oct. 25 2021: Commercial/Multifamily Lending
Sometimes research is like putting a puzzle together – trying to fit one piece of information with another to create a full picture of what’s happening. This week, we are adding a new, final piece to the puzzle of how much commercial real estate lending happens each year.
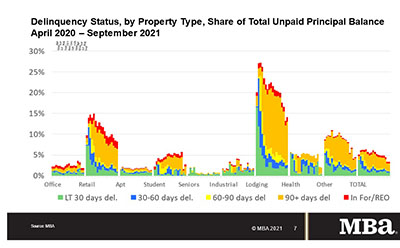
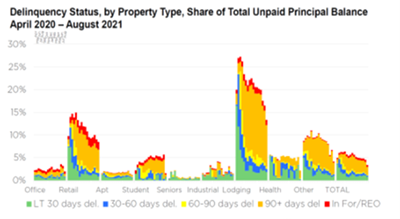
MBA: September Commercial, Multifamily Mortgage Delinquencies Decline
Delinquency rates for mortgages backed by commercial and multifamily properties declined in September, the Mortgage Bankers Association’s latest CREF Loan Performance Survey reported.
MBA: September Commercial, Multifamily Mortgage Delinquencies Decline
Delinquency rates for mortgages backed by commercial and multifamily properties declined in September, the Mortgage Bankers Association’s latest CREF Loan Performance Survey reported.
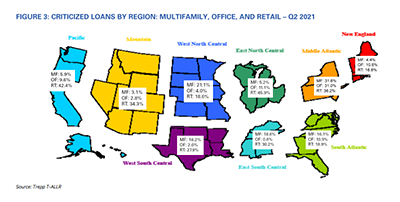
Trepp: Bank Commercial Real Estate Loan Performance ‘Not Bad, But Maybe Not That Great’
Trepp, New York, said delinquency rates for commercial real estate loans held by banks are declining after increasing modestly last year.

MBA: 2Q Commercial/Multifamily Mortgage Debt Outstanding Up 1.5%
Commercial/multifamily mortgage debt outstanding increased by $60.7 billion (1.5 percent) in the second quarter, according to the Mortgage Bankers Association’s latest Commercial/Multifamily Mortgage Debt Outstanding report.
MBA: 2Q Commercial/Multifamily Mortgage Debt Outstanding Up 1.5%
Commercial/multifamily mortgage debt outstanding increased by $60.7 billion (1.5 percent) in the second quarter, according to the Mortgage Bankers Association’s latest Commercial/Multifamily Mortgage Debt Outstanding report.
MBA: Commercial, Multifamily Delinquencies Continue Downward Trend
Delinquency rates of mortgages backed by commercial and multifamily properties have broadly improved in recent months, according to two new Mortgage Bankers Association reports.
MBA: Commercial, Multifamily Delinquencies Continue Downward Trend
Delinquency rates of mortgages backed by commercial and multifamily properties have broadly improved in recent months, according to two new Mortgage Bankers Association reports.