
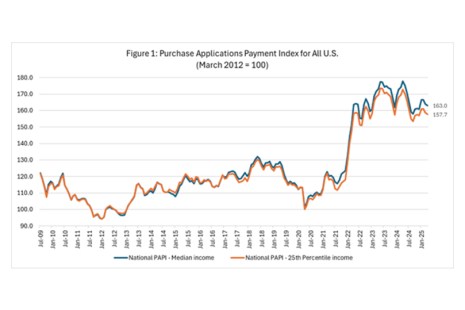
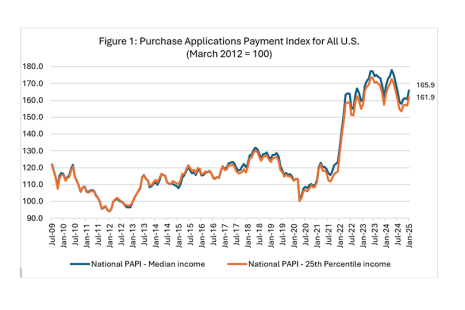
Homebuyer affordability improved in July, with the national median payment applied for by purchase applicants decreasing to $2,127 from $2,172 in June.
Tag: Edward Seiler

MBA: Mortgage Application Payments Decreased in June
Homebuyer affordability improved in June, with the national median payment applied for by purchase applicants decreasing to $2,172 from $2,211 in May, according to MBA’s Purchase Applications Payment Index.

MBA: Mortgage Application Payments Increase in May
Homebuyer affordability declined further in May, with the national median payment applied for by purchase applicants increasing to $2,211.
Mortgage Application Payments Increase in April
Homebuyer affordability declined slightly in April, with the national median payment applied for by purchase applicants increasing to $2,186 from $2,173 in March.

MBA: Mortgage Application Payments Decreased 1.4% to $2,173 in March
Homebuyer affordability improved in March, with the national median payment applied for by purchase applicants decreasing to $2,173 from $2,205 in February.

MBA: Mortgage Application Payments Remain Flat in February
Homebuyer affordability remained flat in February with the national median payment applied for by purchase applicants remaining unchanged at $2,205 in February.
MBA: Mortgage Application Payments Increased 3.7% to $2,205 in January
Homebuyer affordability declined in January, with the national median payment applied for by purchase applicants increasing to $2,205 from $2,127 in December.

MBA: Mortgage Application Payments Flat in December
Homebuyer affordability improved slightly in December, with the national median payment applied for by purchase applicants decreasing to $2,127 from $2,133 in November, according to MBA’s Purchase Applications Payment Index, which measures how new monthly mortgage payments vary across time relative to income using data from MBA’s Weekly Applications Survey.
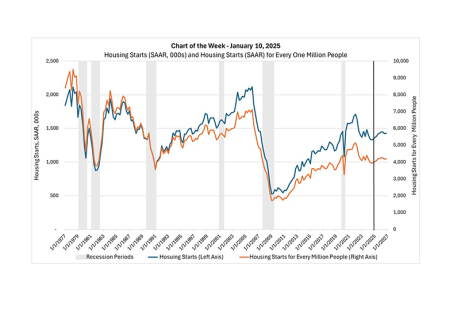
Chart of the Week: Housing Starts and Housing Starts for Every 1 Million People
In this week’s MBA Chart of the Week, we look at one statistic–aggregate single-family and multifamily housing starts–and examine how it has evolved since the start of the Carter Administration.
An Appreciation of Housing Policy Expert John C. Weicher
Former Assistant Secretary for Housing and Federal Housing Commissioner John C. Weicher passed away Dec. 10, 2024.