December’s Job Openings and Labor Turnover Survey (JOLTS) results continued to indicate a soft job market with employers reducing open positions and hiring at a cautious pace, and workers are still voluntarily leaving their jobs at a slower rate.
Tag: Chart of the Week

Chart of the Week: Homeownership Rates by Age, Race and Ethnicity
In this week’s MBA Chart of the Week, we examine the homeownership rate by household age as well as by race and ethnicity.

Chart of the Week: Employee Benefits Costs for Mortgage Lenders, Servicers
The beginning of the year brings changes to employee benefits and associated costs for both mortgage company employers and employees.

Chart of the Week: Lender-Paid Loan Expense and Borrower-Paid Charges and Fees
In recent years as volume has subsided, mortgage lenders have been focused on rising origination expenses, including credit costs.

Chart of the Week: Median First-Time Homebuyer Age
The Washington Post recently published an article examining alternative estimates of first-time homebuyers’ age. MBA members have asked about this data, so this week’s Chart of the Week explores the Post’s analysis and current FTHB data trends.

Chart of the Week: ARM Share of Home Purchase Applications
According to data from MBA’s Builder Applications Survey, 24.6% of applications to purchase a newly built home were adjustable rate mortgage loan applications in October.

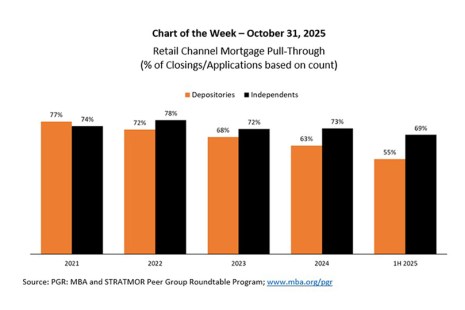
Chart of the Week: Retail Channel Mortgage Pull-Through
At last month’s MBA Annual Convention and Expo in Las Vegas, lenders discussed and debated ways to reduce origination costs and increase productivity by investing in more modern technology, refining the use of technology, and making the loan production process more efficient. Improved servicing recapture and offering a greater variety of non-agency loan products were also explored as ways to achieve scale and spread fixed costs over more origination volume.

Chart of the Week: Purchase-Only House Price by Census Division
Home price growth in many markets around the U.S. is slowing. Based on July 2025 data from the Federal Housing Finance Agency’s House Price Indexes, year-over-year home price growth in the U.S. was 2.3% relative to July 2024.

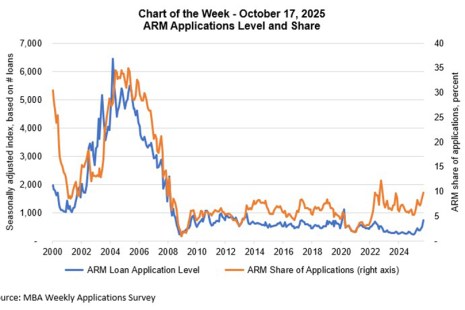
Chart of the Week: ARM Applications Level and Share
Adjustable-rate mortgages (ARMs), when used appropriately, can help ease affordability challenges and provide homeownership and equity building opportunities for qualified borrowers.

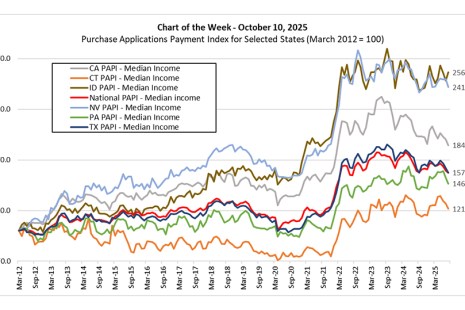
Chart of the Week: Purchase Applications Payment Index for Selected States
In this week’s Chart of the Week, we show the PAPI series – constructed using median Weekly Applications Survey (WAS) payments and median income – for the nation and six selected states.
