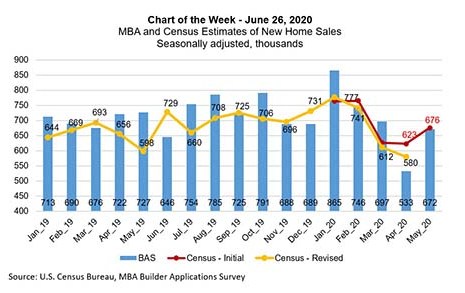
This week’s chart shows how the U.S. Census Bureau’s new home sales series has compared to our Builder Applications Survey data from 2019 through May 2020. The BAS has been a reliable leading indicator of Census’ new home sales data.
Tag: Census Bureau
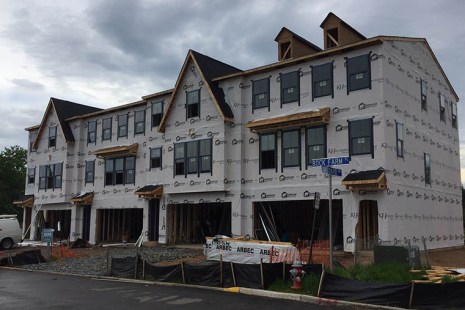
May New Home Sales Post Healthy 16.6% Gain
Home buyer enthusiasm for new homes intensified in May, HUD and the Census Bureau reported yesterday, jumping by 16.6 percent from April and by nearly 13 percent from a year ago.
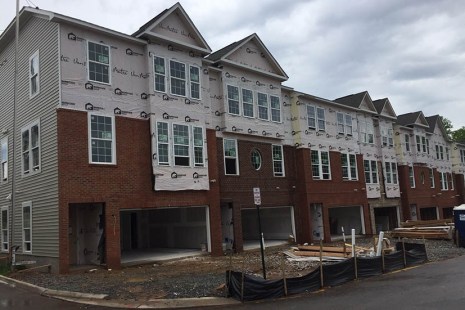
May Housing Starts Post Modest Increase
HUD and the Census Bureau yesterday reported May housing starts improved by 4.3 percent, stopping a two-month freefall in the wake of the coronavirus pandemic.

April New Home Sales Reflect Growing Purchaser Confidence
After several months of brutish news, in which home builder confidence fell to an eight-year low, HUD and the Census Bureau had some good news: April new home sales rose for the first time since January.
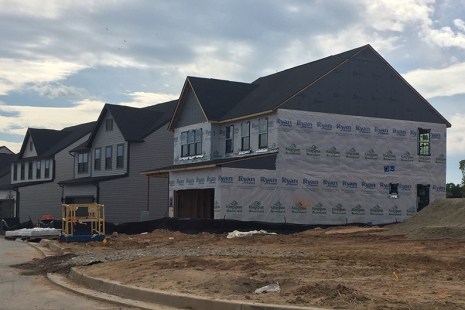
April Housing Starts Follow Now-Familiar COVID-19 Pattern
Housing starts, which fell by more than 22 percent in March, fell by another 30 percent in April to the lowest level since 2013 as the economic effects of the coronavirus pandemic slammed home.
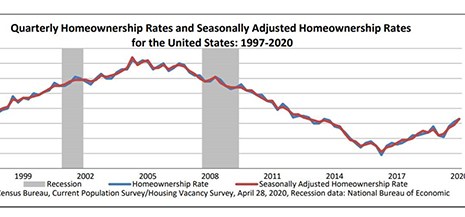
Homeownership Rate Ticks Up to 65.3%
Pre-coronavirus, the nation’s homeownership continued its recovery in the first quarter, rising by 1.1 percent from a year ago to 65.3 percent, the Census Bureau reported yesterday.

March New Home Sales Feel Brunt of Coronavirus
The expected hit to new home sales from the coronavirus pandemic fully manifested itself in March, falling by more than 15 percent from February to its lowest level in six years, HUD and the Census Bureau reported yesterday.
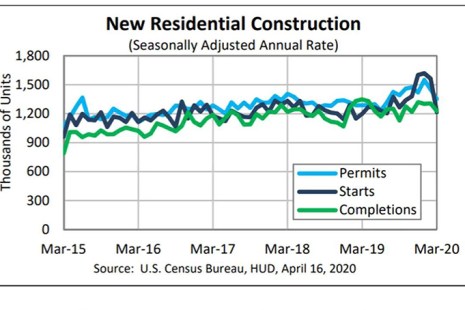
‘Coronavirus Effect’ Takes Aim at March Housing Starts
The economic effects of the coronavirus pandemic showed up in March housings starts, which fell by more than 22 percent, HUD and the Census Bureau reported yesterday.

February New Home Sales Meet Expectations, Pre-Coronavirus
February new home sales dipped a bit, HUD and the Census Bureau reported yesterday. Sales of new single-family houses came in at a seasonally adjusted annual rate of 765,000, down by 4.4 percent from the revised January rate of 800,000, but 14.3 percent higher than a year ago (669,000).

Calm Before the Storm? February Housing Starts Dip 1.5%, Pre-Coronavirus
HUD and the Census Bureau reported privately owned housing starts in February fell slightly to a seasonally adjusted annual rate of 1.599 million—a not discouraging number, analysts said, ahead of the yet-to-be-seen impact of the coronavirus pandemic.

