In this week’s MBA Chart of the Week, we analyze Optimal Blue single-family, 30-year fixed mortgage rate origination loan data from January 2020 through August 2021. We further group loans in the chart by the spread between their reported note rate and the (monthly average of the) Freddie Mac Primary Mortgage Market Survey rates to approximate the APR-APOR spread.
Tag: Annual Percentage Rate
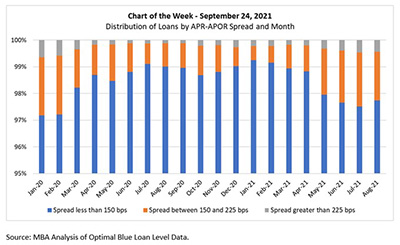
MBA Chart of the Week, Sept. 24, 2021: Distribution of Loans by APR-APOR Spread & Month
In this week’s MBA Chart of the Week, we analyze Optimal Blue single-family, 30-year fixed mortgage rate origination loan data from January 2020 through August 2021. We further group loans in the chart by the spread between their reported note rate and the (monthly average of the) Freddie Mac Primary Mortgage Market Survey rates to approximate the APR-APOR spread.