This week’s MBA Chart of the Week examines the spread between the 30-year fixed mortgage rate and 10-year Treasury yield.
Tag: 30-Year Fixed Mortgage

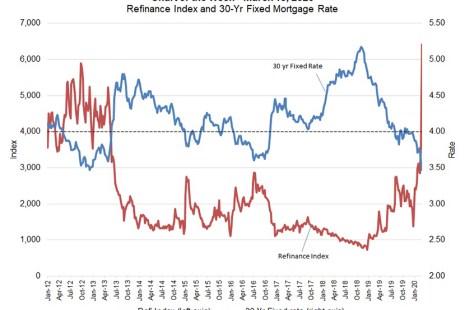
MBA Chart of the Week: Refinance Index and 30-Year Fixed Mortgage Rate
Treasury rates and mortgage rates have fallen to historic lows, driven down by the market turmoil and volatility caused by the uncertainty around the spread of the coronavirus.

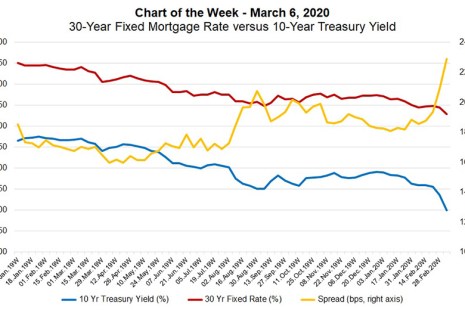
MBA Chart of the Week: 30-Year Fixed Rate vs. 10-Year Treasury
The yield on U.S. 10-year Treasuries fell to record lows last week, driven by increasing concerns regarding the spread of the coronavirus and its impact on the global and U.S. economy. Just last week, there has been an increase in occurrences of business shutdowns, travel restrictions and potential spending reductions.

MBA Chart of the Week: 30-Year Fixed Mortgage vs. 10-Year Treasuries
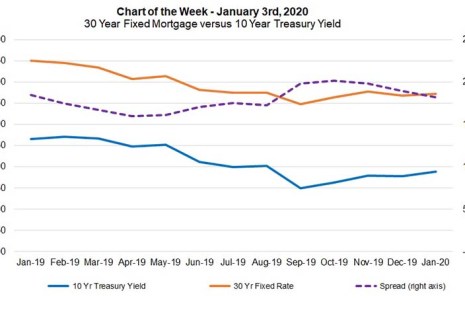
This week’s chart shows the narrowing of the spread between the 30-year fixed mortgage rate and the 10-year Treasury yield–from a high of 208 basis points in September to 183 basis points at the end of December.

MBA Chart of the Week: 30-Year Fixed Mortgage vs. 10-Year Treasuries
This week’s chart shows the narrowing of the spread between the 30-year fixed mortgage rate and the 10-year Treasury yield–from a high of 208 basis points in September to 183 basis points at the end of December.

