MBA Chart of the Week: 30-Year Fixed Mortgage vs. 10-Year Treasuries

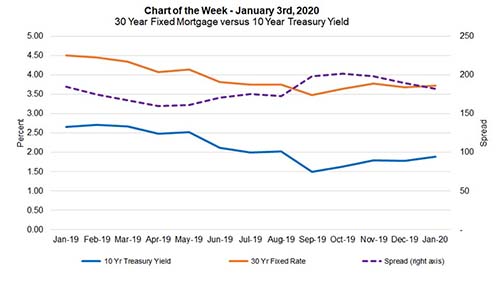
This week’s chart shows the narrowing of the spread between the 30-year fixed mortgage rate and the 10-year Treasury yield–from a high of 208 basis points in September to 183 basis points at the end of December.
This narrowing of the spread coincided with the burst in refinance application activity that peaked late last August, as capacity constraints started to kick in. The average 30-year fixed rate fell to a recent low of 3.5 percent in September (as tracked by Freddie Mac), but increased to around 3.7 percent over the past month. Not surprisingly, refinance activity has declined around 20 percent over this time.
With 2020 here, we forecast that the 10-year Treasury rate will average around 1.9 percent, and for the 30-year fixed-rate mortgage rate to average 3.7 percent–roughly the same as 2019–before reaching 4 percent by 2022. However, even though our rates forecast is essentially flat, we expect that some of the market volatility seen in 2019 from trade threats and elevated geopolitical uncertainties will remain this year.
If refinance volume does wane as expected in the second half of 2020, the margin pressures many mortgage companies faced in 2018 may reappear this year. While our most recent Quarterly Performance Report (for Q3 2019) showed that independent mortgage bank profits were at a seven-year high and expenses per loan were down, this was driven mostly by the increased refinance volume.
The industry continues to be challenged by elevated costs, and as we saw in 2018 when originations slowed, the competitive nature of the industry pushed revenues lower as lenders had fewer loans.
(Joel Kan is associate vice president of economic and industry forecasting with MBA; he can be reached at jkan@mba.org.)