

MBA: Mortgage Application Payments Increased in April

Homebuyer affordability declined in April, with the national median payment applied for by purchase applicants increasing to $2,152 from $2,131 in March. This is according to the Mortgage Bankers Association’s (MBA) Purchase Applications Payment Index (PAPI), which measures how new monthly mortgage payments vary across time – relative to income – using data from MBA’s Weekly Applications Survey (WAS).
“Housing affordability conditions weakened slightly in April, as mortgage rates edged higher and rising loan amounts pushed monthly payments up from March. However, affordability remains improved compared to a year ago, supported by lower mortgage rates and continued income growth,” said Edward Seiler, MBA’s Associate Vice President of Housing Economics and Executive Director of the Research Institute for Housing America. “Looking ahead, continued income gains and some stabilization in mortgage rates could help support better affordability conditions.”
An increase in MBA’s PAPI – indicative of declining borrower affordability conditions – means that the mortgage payment to income ratio (PIR) is higher due to increasing application loan amounts, rising mortgage rates, or a decrease in earnings. A decrease in the PAPI – indicative of improving borrower affordability conditions – occurs when loan application amounts decrease, mortgage rates decrease, or earnings increase.
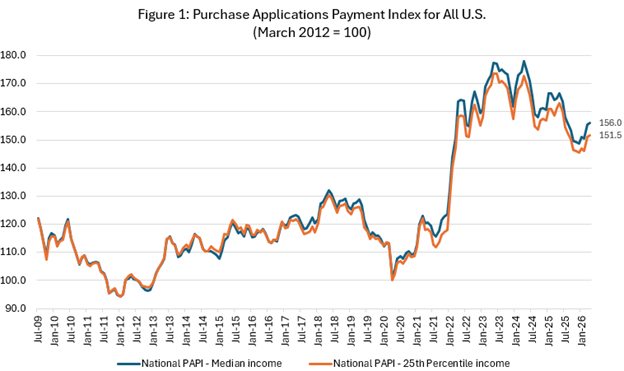
The national PAPI (Figure 1) increased 0.3% to 156.0 in April from 155.5 in March. While payments decreased 1.6%, earnings growth of 4% means that the PAPI is down (affordability is higher) 5.3% on an annual basis. For borrowers applying for lower-payment mortgages (the 25th percentile), the national mortgage payment increased to $1,493 in April from $1,479 in March.
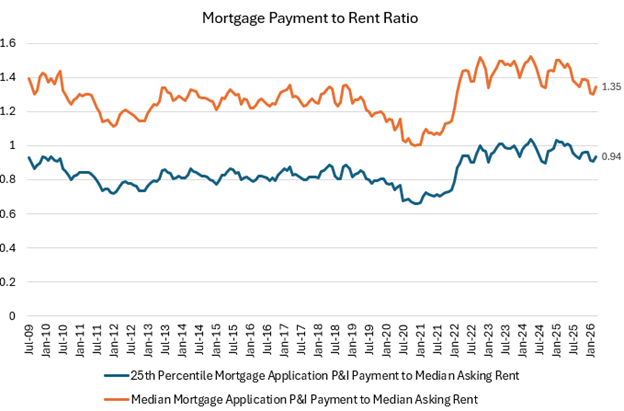
MBA’s national mortgage payment to rent ratio (MPRR) decreased from 1.38 at the end of the fourth quarter (December 2025) to 1.35 at the end of the first quarter (March 2026), meaning mortgage payments for home purchases have decreased relative to rents. The Census Bureau’s HVS national median asking rent in first-quarter 2026 increased to $1,579 ($1,464 in fourth-quarter 2025). The 25th percentile mortgage application payment to median asking rent ratio decreased to 0.94 in March (0.96 in December 2025).
The Builders’ Purchase Application Payment Index (BPAPI) showed that the median mortgage payment for purchase mortgages from MBA’s Builder Application Survey decreased to $2,188 in April from $2,210 in March.
Additional Key Findings of MBA’s Purchase Applications Payment Index (PAPI) – April 2026
• The national median mortgage payment was $2,152 in April 2026—up $21 from March. It was down by $35 from one year ago, equal to a 1.6% decrease.
• The national median mortgage payment for FHA loan applicants was $1,829 in April, up from $1,812 in March and down from $1,895 in April 2025.
• The national median mortgage payment for conventional loan applicants was $2,166, up from $2,145 in March and down from $2,206 in April 2025.
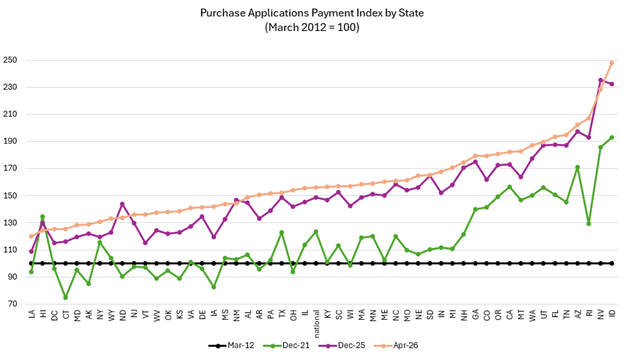
• The top five states with the highest PAPI were: Idaho (248.1), Nevada (228.4), Rhode Island (206.9), Arizona (202.2), and Tennessee (194.8).
• The top five states with the lowest PAPI were: Louisiana (120.1), Hawaii (124.4), D.C. (125.2), Connecticut (125.2), New York (116.7), and Maryland (128.4).
• Homebuyer affordability decreased for Black households, with the national PAPI increasing from 161.0 in March to 161.5 in April.
• Homebuyer affordability decreased for Hispanic households, with the national PAPI increasing from 143.9 in March to 144.3 in April.
• Homebuyer affordability decreased for White households, with the national PAPI increasing from 156.8 in March to 157.3 in April.
About MBA’s Purchase Applications Payment Index
The Mortgage Bankers Association’s Purchase Applications Payment Index (PAPI) measures how new mortgage payments vary across time relative to income. Higher index values indicate that the mortgage payment to income ratio (PIR) is higher than in a month where the index is lower. Contrary to other affordability indexes that make multiple assumptions about mortgage underwriting criteria to estimate mortgage payment level, PAPI directly uses MBA’s Weekly Applications Survey (WAS) data to calculate mortgage payments.
PAPI uses usual weekly earnings data from the U.S. Bureau of Labor Statistics’ Current Population Survey (CPS). Usual weekly earnings represent full-time wage and salary earnings before taxes and other deductions and include any overtime pay, commissions, or tips usually received. Note that data are not seasonally adjusted.
MBA’s Builders’ Purchase Application Payment Index (BPAPI) uses MBA’s Builder Application Survey (BAS) data to create an index that measures how new mortgage payments vary across time relative to income, with a focus exclusively on newly built single-family homes. As with PAPI, higher index values indicate that the mortgage payment to income ratio (PIR) is higher than in a month where the index is lower. To create BPAPI, principal and interest payment amounts are deflated by the same earnings series as in PAPI.
The rent data series calculated for MBA’s national mortgage payment to rent ratio (MPRR) comes from the U.S. Census Bureau’s Housing Vacancies and Homeownership (HVS) survey’s median asking rent. The HVS data is quarterly, and as such, the mortgage payment to rent ratio will be updated quarterly. The HVS data is quarterly, and as such, the mortgage payment to rent ratio will be updated quarterly.
For additional information on MBA’s Purchase Applications Payment Index, click here.
