MBA: Mortgage Application Payments Increased in January

Homebuyer affordability declined in January, with the national median payment applied for by purchase applicants increasing to $2,070 from $2,025 in December. This is according to the Mortgage Bankers Association’s Purchase Applications Payment Index (PAPI), which measures how new monthly mortgage payments vary across time–relative to income–using data from MBA’s Weekly Applications Survey (WAS).
“Housing affordability declined in January, with the national PAPI increasing for the first time in seven months and applicants’ median monthly payment up $45 compared to December,” said Edward Seiler, MBA’s Associate Vice President of Housing Economics and Executive Director of the Research Institute for Housing America. “While the median purchase application amount rose from $320,000 to $332,000, mortgage rates declined over the month. With mortgage rates mostly trending downward, and home-price growth flat or down in many markets, affordability conditions should improve in the months ahead as housing inventory increases.”
An increase in MBA’s PAPI–indicative of declining borrower affordability conditions–means that the mortgage payment to income ratio (PIR) is higher due to increasing application loan amounts, rising mortgage rates, or a decrease in earnings. A decrease in the PAPI–indicative of improving borrower affordability conditions–occurs when loan application amounts decrease, mortgage rates decrease, or earnings increase.
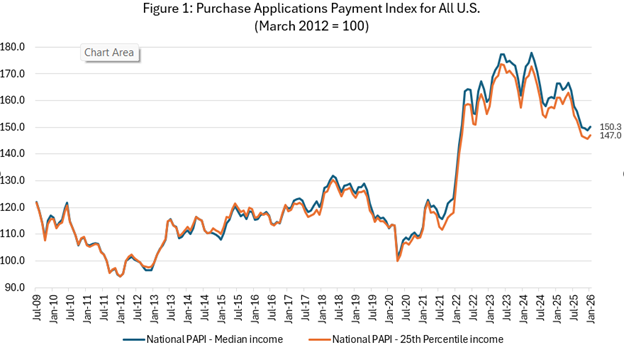
The national PAPI (Figure 1) increased 1% to 150.3 in January from 148.8 in December. While payments decreased 6.1%, earnings growth of 4% means that the PAPI is down (affordability is higher) 9.7% on an annual basis. For borrowers applying for lower-payment mortgages (the 25th percentile), the national mortgage payment increased to $1,445 in January from $1,413 in December.
The Builders’ Purchase Application Payment Index (BPAPI) showed that the median mortgage payment for purchase mortgages from MBA’s Builder Application Survey decreased to $2,161 in January from $2,173 in December.
Additional Key Findings of MBA’s Purchase Applications Payment Index (PAPI) – January 2026
• The national median mortgage payment was $2,070 in January 2026–up $45 from December. It was down by $135 from one year ago, equal to a 6.1% decrease.
• The national median mortgage payment for FHA loan applicants was $1,782 in January, down from $1,802 in December and down from $1,934 in January 2025.
• The national median mortgage payment for conventional loan applicants was $2,081, up from $2,036 in December and down from $2,225 in January 2025.
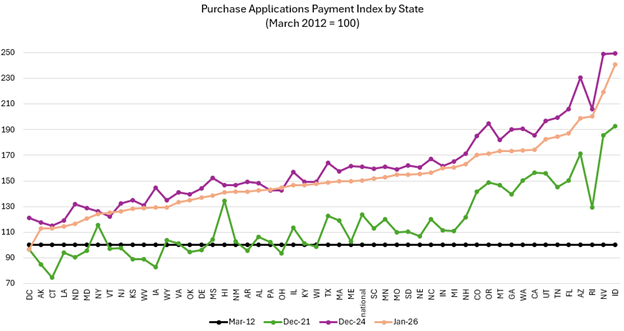
• The top five states with the highest PAPI were: Idaho (240.8), Nevada (219.5), Rhode Island (200.2), Arizona (199.1), and Florida (187.2).
• The top five states with the lowest PAPI were: D.C. (96.5), Alaska (112.8), Connecticut (113.2), Louisiana (114.4), and North Dakota (116.7).
• Homebuyer affordability decreased for Black households, with the national PAPI increasing from 153.8 in December to 155.3 in January.
• Homebuyer affordability decreased for Hispanic households, with the national PAPI increasing from 141.1 in December to 142.5 in January.
• Homebuyer affordability decreased for White households, with the national PAPI increasing from 150.5 in December to 152.0 in January.
About MBA’s Purchase Applications Payment Index
The Mortgage Bankers Association’s Purchase Applications Payment Index (PAPI) measures how new mortgage payments vary across time relative to income. Higher index values indicate that the mortgage payment to income ratio (PIR) is higher than in a month where the index is lower. Contrary to other affordability indexes that make multiple assumptions about mortgage underwriting criteria to estimate mortgage payment level, PAPI directly uses MBA’s Weekly Applications Survey (WAS) data to calculate mortgage payments.
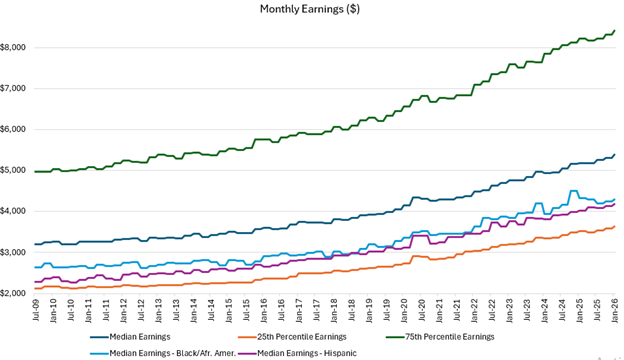
PAPI uses usual weekly earnings data from the U.S. Bureau of Labor Statistics’ Current Population Survey (CPS). Usual weekly earnings represent full-time wage and salary earnings before taxes and other deductions and include any overtime pay, commissions, or tips usually received. Note that data are not seasonally adjusted.
MBA’s Builders’ Purchase Application Payment Index (BPAPI) uses MBA’s Builder Application Survey (BAS) data to create an index that measures how new mortgage payments vary across time relative to income, with a focus exclusively on newly built single-family homes. As with PAPI, higher index values indicate that the mortgage payment to income ratio (PIR) is higher than in a month where the index is lower. To create BPAPI, principal and interest payment amounts are deflated by the same earnings series as in PAPI.
The rent data series calculated for MBA’s national mortgage payment to rent ratio (MPRR) comes from the U.S. Census Bureau’s Housing Vacancies and Homeownership (HVS) survey’s median asking rent. The HVS data is quarterly, and as such, the mortgage payment to rent ratio will be updated quarterly. MPRR data was not included in the January 2026 data.
For additional information on MBA’s Purchase Applications Payment Index, click here.