Chart of the Week: IMB Pre-Tax Net Production Income by Average Loan Balance in Q1 2025
(Image courtesy of MBA)
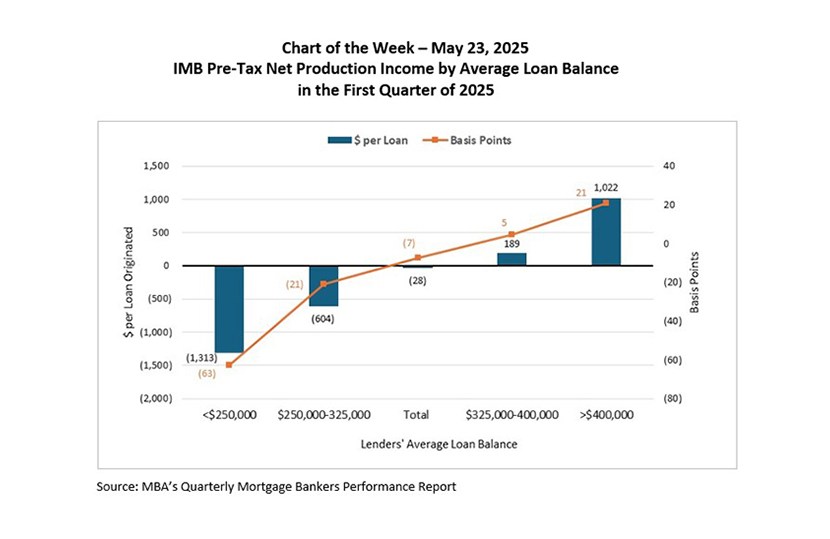
Independent mortgage banks (IMBs) and mortgage subsidiaries of chartered banks reported a pre-tax net loss of $28 on each loan they originated in the first quarter of 2025, compared to a net loss of $40 per loan in the fourth quarter of 2024, according to the Mortgage Bankers Association’s (MBA) newly released Quarterly Mortgage Bankers Performance Report. The average pre-tax production loss was 7 basis points (bps) in the first quarter of 2025, compared to a loss of 4 bps in the fourth quarter of 2024.
As in past quarters, production profits varied across lenders based on several factors including total originations volume, average loan balance, production channel, geographic region, and government vs conventional product mix, among others. For example, lenders with less than $100 million in dollar volume posted the largest average losses – at over $1,000 per loan. Full results based on peer group breakouts for these attributes are available each quarter in our report.
For this Chart of the Week, the relationship between production profitability and lenders’ average loan balances in the first quarter of 2025 is displayed. Lenders with lower average loan balances – less than $250,000 – recorded average production losses of over $1,300 per loan, or 63 basis points. Meanwhile, lenders with the highest average loan balances– more than $400,000 – stayed in the black and recorded average production profits of $1,022 per loan, or 21 basis points. While total production expenses were higher for the two peer groups with the highest average loan balances, production revenues more than offset these cost escalations
Note: Pre-tax net production income is defined as total revenues (fee income, secondary marketing income, value of capitalized servicing/servicing released premiums at origination and net warehouse spread) minus fully-loaded production costs (sales, fulfillment, production support and corporate costs), divided by production volume in dollars ($), multiplied by 10,000 for basis points, and divided by loan production count for dollars per loan.
– Marina B. Walsh, CMB (mwalsh@mba.org); Jenny Masoud (jmasoud@mba.org)