MBA: Mortgage Application Payments Decreased in November
Homebuyer affordability improved slightly in November, with the national median payment applied for by purchase applicants decreasing to $2,034 from $2,039 in October. This is according to the Mortgage Bankers Association’s (MBA) Purchase Applications Payment Index (PAPI), which measures how new monthly mortgage payments vary across time – relative to income – using data from MBA’s Weekly Applications Survey (WAS).
“Affordability conditions have now improved for six straight months as lower mortgages rates and strong household earnings growth has increased prospective buyers’ purchasing power,” said Edward Seiler, MBA’s Associate Vice President of Housing Economics and Executive Director of the Research Institute for Housing America. “The national median mortgage payment was down $99 compared to November 2024. MBA expects that affordability conditions will continue to improve in 2026, with house prices forecast to fall nationally by 0.3% and mortgage rates forecast to remain around 6.4% throughout the year.”
An increase in MBA’s PAPI–indicative of declining borrower affordability conditions–means that the mortgage payment to income ratio (PIR) is higher due to increasing application loan amounts, rising mortgage rates, or a decrease in earnings. A decrease in the PAPI–indicative of improving borrower affordability conditions–occurs when loan application amounts decrease, mortgage rates decrease, or earnings increase.
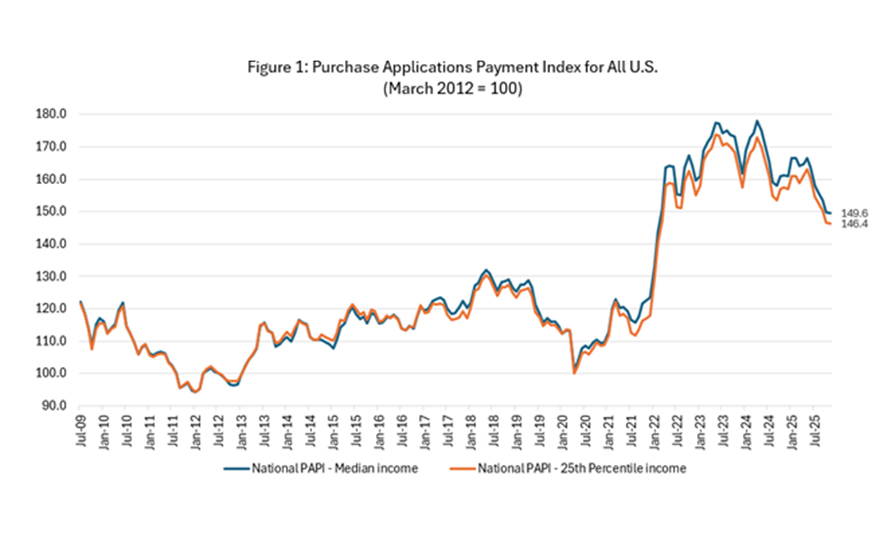
The national PAPI (Figure 1) decreased 0.2$ to 149.6 in November from 149.8 in October. While payments decreased 4.6%, earnings growth of 2.9% means that the PAPI is down (affordability is higher) 7.3% on an annual basis. For borrowers applying for lower-payment mortgages (the 25th percentile), the national mortgage payment increased to $1,409 in November from $1,402 in October.
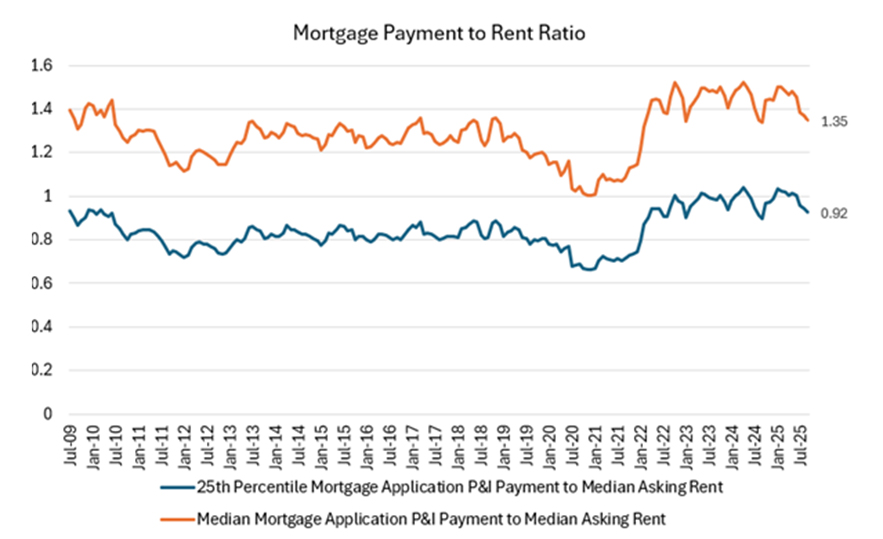
MBA’s national mortgage payment to rent ratio (MPRR) decreased from 1.45 at the end of the second quarter (June 2025) to 1.35 at the end of the third quarter (September 2025), meaning mortgage payments for home purchases have decreased relative to rents. The Census Bureau’s HVS national median asking rent in the third-quarter 2025 increased to $1,534 ($1,494 in second-quarter 2025). The 25th percentile mortgage application payment to median asking rent ratio decreased to 0.92 in September (1.00 in June 2025).
Additional Key Findings of MBA’s Purchase Applications Payment Index (PAPI) – November 2025
• The national median mortgage payment was $2,034 in November 2025–down $5 from October. It was down by $99 from one year ago, equal to a 4.6% decrease.
• The national median mortgage payment for FHA loan applicants was $1,776 in November, down from $1,789 in October and down from $1,898 in November 2024.
• The national median mortgage payment for conventional loan applicants was $2,063, the same as in September and down from $2,133 in November 2024.
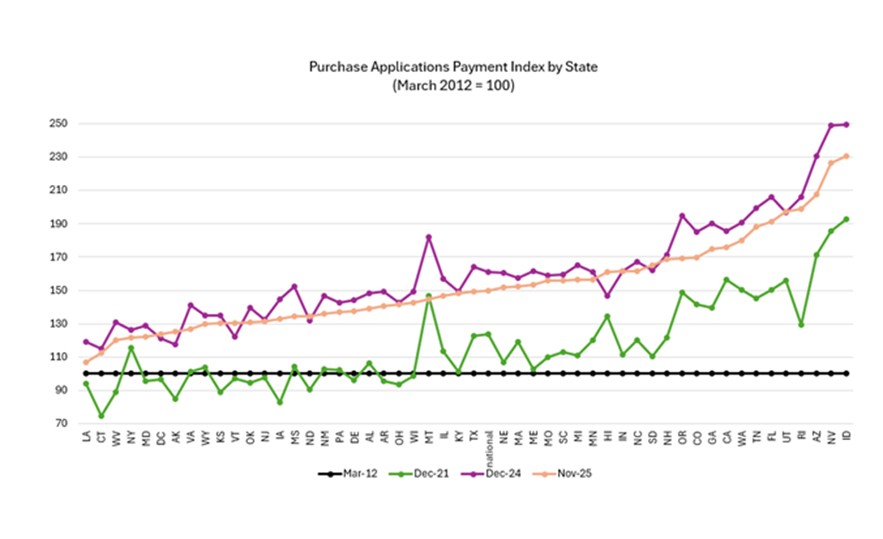
• The top five states with the highest PAPI were: Idaho (230.7), Nevada (226.3), Arizona (207.6), Rhode Island (198.7), and Utah (197.1).
• The top five states with the lowest PAPI were: Louisiana (106.7), Connecticut (112.4), West Virginia (119.9), New York (121.4), and Maryland (122.1).
• Homebuyer affordability increased for Black households, with the national PAPI decreasing from 154.9 in October to 154.6 in November.
• Homebuyer affordability increased for Hispanic households, with the national PAPI decreasing from 142.1 in October to 141.8 in November.
• Homebuyer affordability increased for White households, with the national PAPI decreasing from 151.6 in October to 151.2 in November.
About MBA’s Purchase Applications Payment Index
The Mortgage Bankers Association’s Purchase Applications Payment Index (PAPI) measures how new mortgage payments vary across time relative to income. Higher index values indicate that the mortgage payment to income ratio (PIR) is higher than in a month where the index is lower. Contrary to other affordability indexes that make multiple assumptions about mortgage underwriting criteria to estimate mortgage payment level, PAPI directly uses MBA’s Weekly Applications Survey (WAS) data to calculate mortgage payments.
PAPI uses usual weekly earnings data from the U.S. Bureau of Labor Statistics’ Current Population Survey (CPS). Usual weekly earnings represent full-time wage and salary earnings before taxes and other deductions and include any overtime pay, commissions, or tips usually received. Note that data are not seasonally adjusted.
MBA’s Builders’ Purchase Application Payment Index (BPAPI) uses MBA’s Builder Application Survey (BAS) data to create an index that measures how new mortgage payments vary across time relative to income, with a focus exclusively on newly built single-family homes. As with PAPI, higher index values indicate that the mortgage payment to income ratio (PIR) is higher than in a month where the index is lower. To create BPAPI, principal and interest payment amounts are deflated by the same earnings series as in PAPI.
The rent data series calculated for MBA’s national mortgage payment to rent ratio (MPRR) comes from the U.S. Census Bureau’s Housing Vacancies and Homeownership (HVS) survey’s median asking rent. The HVS data is quarterly, and as such, the mortgage payment to rent ratio will be updated quarterly.
For additional information on MBA’s Purchase Applications Payment Index, click here.