Mortgage Delinquencies Decrease Slightly in the Second Quarter

The delinquency rate for mortgage loans on one-to-four-unit residential properties decreased to a seasonally adjusted rate of 3.93% of all loans outstanding at the end of the second quarter of 2025, according to the Mortgage Bankers Association’s (MBA) National Delinquency Survey.
The delinquency rate was down 11 basis points from the first quarter of 2025 and down 4 basis points from one year ago. The percentage of loans on which foreclosure actions were started in the second quarter fell by 3 basis points to 0.17%.
“The seasonally-adjusted mortgage delinquency rate declined to 3.93% in the second quarter and remains below the historic average of 5.21% dating back to 1979,” said Marina Walsh, CMB, MBA’s Vice President of Industry Analysis. “Conventional loan performance continues to perform exceptionally well, with delinquencies hovering near record lows. This contrasts with the rise in government delinquencies over the past few years.”
Added Walsh, “While overall mortgage delinquencies are relatively flat compared to last year, the composition has changed. Earlier-stage delinquencies declined while serious delinquencies – those loans 90 or more days delinquent or in foreclosure–increased. This was the case in the second quarter of 2025 across the three major product types: conventional, FHA, and VA.”
Walsh noted that the labor market has shown early signs of weakness, and the balances and delinquencies of other forms of consumer debt such as student loans, credit card, and auto loans have grown. These factors suggest future increases in mortgage delinquencies.
Key Findings of MBA’s Second Quarter of 2025 National Delinquency Survey:
• Compared to last quarter, the seasonally adjusted mortgage delinquency rate decreased for all loans outstanding. By stage, the 30-day delinquency rate decreased 4 basis points to 2.10%, the 60-day delinquency rate decreased 1 basis point to 0.72%, and the 90-day delinquency bucket decreased 6 basis points to 1.11%.
• By loan type, the total seasonally adjusted delinquency rate for conventional loans decreased 10 basis points to 2.60% over the previous quarter. The total FHA seasonally adjusted delinquency rate decreased 5 basis points to 10.57%, and the total VA seasonally adjusted delinquency rate decreased 31 basis points to 4.32%.
• On a year-over-year basis, total mortgage delinquencies decreased for all loans outstanding. The delinquency rate decreased 4 basis points for conventional loans, decreased 3 basis points for FHA loans and decreased 31 basis points for VA loans from the previous year.
• The delinquency rate includes loans that are at least one payment past due but does not include loans in the process of foreclosure. The percentage of loans in the foreclosure process at the end of the second quarter was 0.48%, down 1 basis point from the first quarter of 2025 and 5 basis points higher than one year ago.
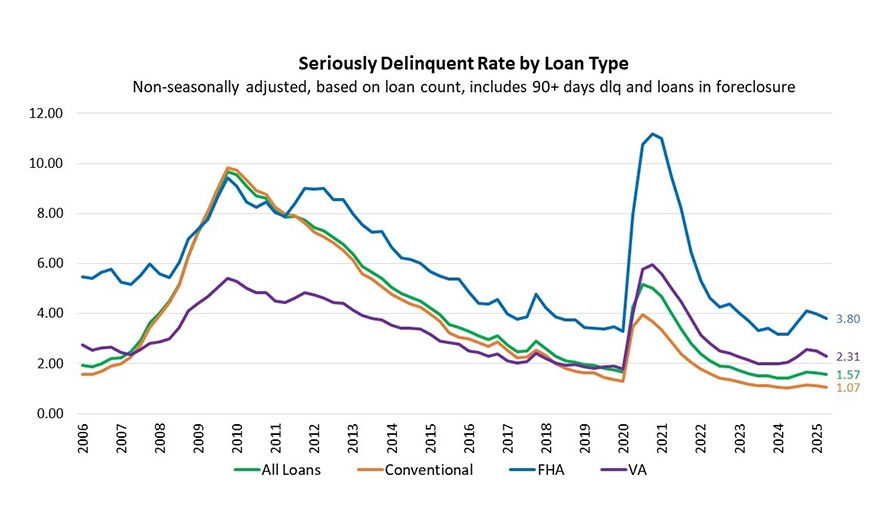
• The non-seasonally adjusted seriously delinquent rate, the percentage of loans that are 90 days or more past due or in the process of foreclosure, was 1.57%. It decreased 6 basis points from last quarter and increased 14 basis points from last year. The seriously delinquent rate decreased 4 basis points for conventional loans, decreased 18 basis points for FHA loans, and decreased 20 basis points for VA loans from the previous quarter. Compared to a year ago, the seriously delinquent rate increased 3 basis points for conventional loans, increased 63 basis points for FHA loans and increased 24 basis points for VA loans.
• The five states with the largest quarterly increases in their overall non-seasonally adjusted delinquency rate were: Mississippi (42 basis points), North Dakota (42 basis points), Ohio (40 basis points), Michigan (38 basis points) and West Virginia (36 basis points).
For the purposes of the survey, MBA asks servicers to report loans in forbearance as delinquent if the payment was not made based on the original terms of the mortgage.
NOTE: For non-seasonally-adjusted (NSA) supplemental information on the performance of servicing portfolios by investor type, loans in forbearance by investor type, and the status of post-forbearance workouts, as well as servicer call volume metrics, please refer to MBA’s Monthly Loan Monitoring Survey at www.mba.org/lms.