MBA: Mortgage Application Payments Placeholder
Homebuyer affordability declined in January, with the national median payment applied for by purchase applicants increasing to $2,134 from $2,055 in December. This is according to the Mortgage Bankers Association’s (MBA) Purchase Applications Payment Index (PAPI), which measures how new monthly mortgage payments vary across time – relative to income – using data from MBA’s Weekly Applications Survey (WAS).
“Homebuyer affordability conditions declined in January, with higher home prices pushing loan amounts upward and ultimately offsetting what was a monthly decline in mortgage rates,” said Edward Seiler, MBA’s Associate Vice President, Housing Economics, and Executive Director, Research Institute for Housing America. “Mortgage rates have risen throughout February and will likely continue to hamper affordability and prospective homebuyers’ ability to buy heading into spring.”
An increase in MBA’s PAPI – indicative of declining borrower affordability conditions – means that the mortgage payment to income ratio (PIR) is higher due to increasing application loan amounts, rising mortgage rates, or a decrease in earnings. A decrease in the PAPI – indicative of improving borrower affordability conditions – occurs when loan application amounts decrease, mortgage rates decrease, or earnings increase.
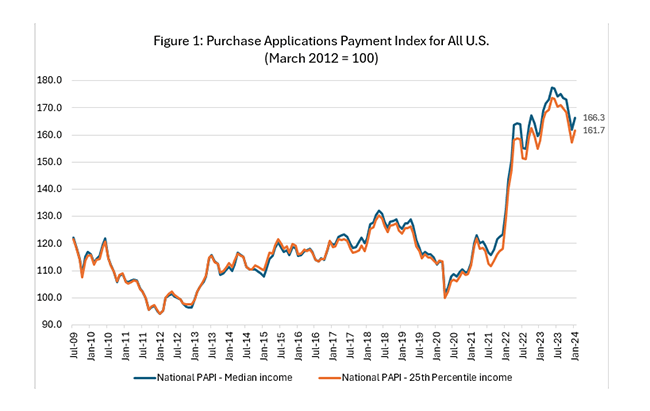
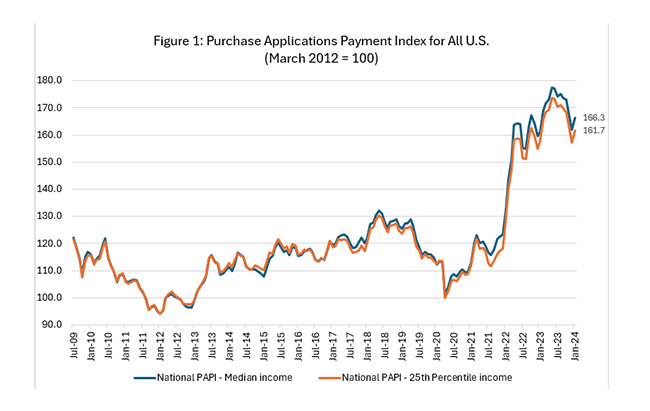
The national PAPI (Figure 1) increased 3.8 percent to 166.3 in January from 161.8 in December. Median earnings were up 5.2 percent compared to one year ago, and while payments increased 8.6 percent, the strong earnings growth means that the PAPI is up 3.3 percent on an annual basis. For borrowers applying for lower-payment mortgages (the 25th percentile), the national mortgage payment increased to $1,438 in January from $1,375 in December.
The Builders’ Purchase Application Payment Index (BPAPI) showed that the median mortgage payment for purchase mortgages from MBA’s Builder Application Survey decreased to $2,501 in January from $2,541 in December.
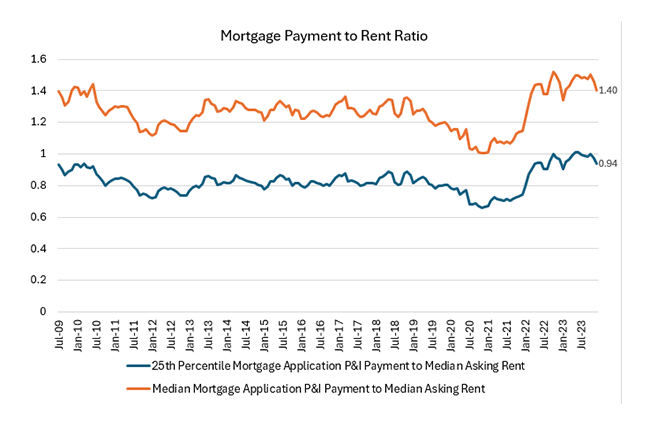
MBA’s national mortgage payment to rent ratio (MPRR) decreased from 1.47 at the end of the third quarter (September 2023) to 1.40 at the end of the fourth quarter (December 2023), meaning mortgage payments for home purchases have decreased relative to rents. The Census Bureau’s Housing Vacancies Survey (HVS) national median asking rent in fourth-quarter 2023 increased 0.2 percent on a quarterly basis to $1,465 ($1,462 in the third-quarter 2023). The 25th percentile mortgage application payment to median asking rent ratio decreased slightly to 0.94 in December (0.98 in September 2023).
Additional Key Findings of MBA’s Purchase Applications Payment Index (PAPI) – January 2024
The national median mortgage payment was $2,134 in January—up $78 from December. It is up $170 from one year ago, equal to an 8.6% increase.
The national median mortgage payment for FHA loan applicants was $1,830 in January, up from $1,822 in December and up from $1,619 in January 2023.
The national median mortgage payment for conventional loan applicants was $2,147, up from $2,053 in December and up from $2,009 in January 2023.
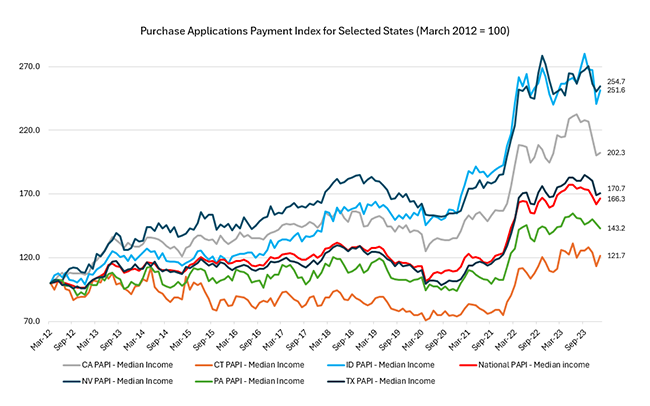
The top five states with the highest PAPI were: Nevada (254.7), Idaho (251.6), Arizona (229.7), Florida (218.3), and South Dakota (213.3).
The top five states with the lowest PAPI were: Louisiana (118.8), New York (120.9), Connecticut (121.7), West Virginia, (125.4) and Alaska (126.2).
Homebuyer affordability decreased for Black households, with the national PAPI increasing from 158.2 in December to 162.6 in January.
Homebuyer affordability decreased for Hispanic households, with the national PAPI increasing from 154.5 in December to 158.8 in January.
Homebuyer affordability decreased for White households, with the national PAPI increasing from 165.1 in December to 169.7 in January.
About MBA’s Purchase Applications Payment Index
The Mortgage Bankers Association’s Purchase Applications Payment Index (PAPI) measures how new mortgage payments vary across time relative to income. Higher index values indicate that the mortgage payment to income ratio (PIR) is higher than in a month where the index is lower. Contrary to other affordability indexes that make multiple assumptions about mortgage underwriting criteria to estimate mortgage payment level, PAPI directly uses MBA’s Weekly Applications Survey (WAS) data to calculate mortgage payments.
PAPI uses usual weekly earnings data from the U.S. Bureau of Labor Statistics’ Current Population Survey (CPS). Usual weekly earnings represent full-time wage and salary earnings before taxes and other deductions and include any overtime pay, commissions, or tips usually received. Note that data are not seasonally adjusted.
MBA’s Builders’ Purchase Application Payment Index (BPAPI) uses MBA’s Builder Application Survey (BAS) data to create an index that measures how new mortgage payments vary across time relative to income, with a focus exclusively on newly built single-family homes. As with PAPI, higher index values indicate that the mortgage payment to income ratio (PIR) is higher than in a month where the index is lower. To create BPAPI, principal and interest payment amounts are deflated by the same earnings series as in PAPI.
The rent data series calculated for MBA’s national mortgage payment to rent ratio (MPRR) comes from the U.S. Census Bureau’s Housing Vacancies and Homeownership (HVS) survey’s median asking rent. The HVS data is quarterly, and as such, the mortgage payment to rent ratio will be updated quarterly.
For additional information on MBA’s Purchase Applications Payment Index, click here.