MBA: February Share of Mortgage Loans in Forbearance Decreases to 0.60%
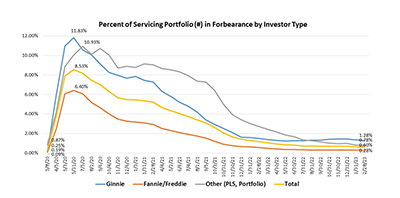
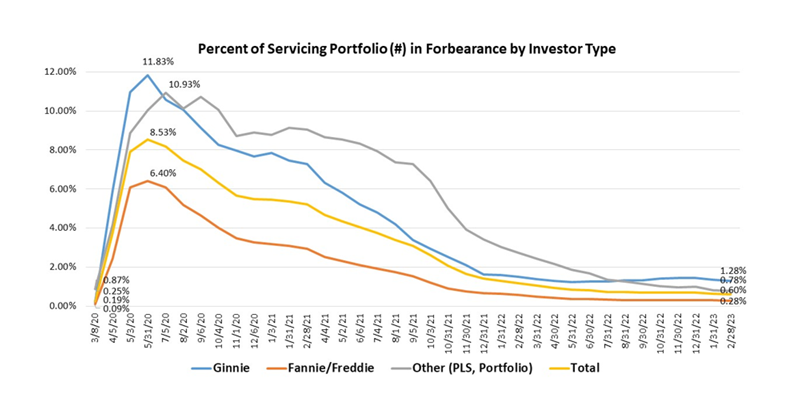
The Mortgage Bankers Association’s monthly Loan Monitoring Survey reported loans in forbearance decreased by 4 basis points tp 0.60% of servicers’ portfolio volume as of February 28 from 0.64% in January. MBA estimates 300,000 homeowners are in forbearance plans.
The share of Fannie Mae and Freddie Mac loans in forbearance decreased 2 basis points to 0.28%. Ginnie Mae loans in forbearance decreased 9 basis points to 1.28%, while the forbearance share for portfolio loans and private-label securities decreased 5 basis points to 0.78%.
“The forbearance rate decreased for both independent mortgage bank and depository servicers across all investor types in February,” said Marina Walsh, CMB, MBA Vice President of Industry Analysis. “Even with the fewer days in the month – which often causes a drop in timely monthly payments – overall servicing portfolio performance declined only slightly to 95.8%, while performance of post-forbearance workouts stayed essentially flat at 76.0%.”
“The February results on mortgage performance is welcome news, given recent increases in delinquencies for other credit types such as credit cards and auto loans,” Walsh added. “However, with the possibility of a recession this year, we may see some deterioration in performance – particularly for government loans.”
Key Findings of the MBA Loan Monitoring Survey – February 1 – 28
- Total loans in forbearance decreased by 4 basis points in February 2023 relative to January 2023: from 0.64% to 0.60%.
- By investor type, the share of Ginnie Mae loans in forbearance decreased from 1.37% to 1.28%.The share of Fannie Mae and Freddie Mac loans in forbearance decreased from 0.30% to 0.28%.
- The share of other loans (e.g., portfolio and PLS loans) in forbearance decreased from 0.83% to 0.78%.
- Loans in forbearance as a share of servicing portfolio volume (#) as of February 28:
- Total: 0.60% (previous month: 0.64%)Independent Mortgage Banks (IMBs): 0.81% (previous month: 0.86%)
- Depositories: 0.40% (previous month: 0.42%)
- By stage, 34.9% of total loans in forbearance are in the initial forbearance plan stage, while 51.8% are in a forbearance extension. The remaining 13.3% are forbearance re-entries, including re-entries with extensions.
- Of the cumulative forbearance exits for the period from June 1, 2020, through February 28, 2023, at the time of forbearance exit:
- 29.6% resulted in a loan deferral/partial claim.
- 18.0% represented borrowers who continued to make their monthly payments during their forbearance period.
- 17.6% represented borrowers who did not make all of their monthly payments and exited forbearance without a loss mitigation plan in place yet.
- 16.1% resulted in a loan modification or trial loan modification.
- 10.9% resulted in reinstatements, in which past-due amounts are paid back when exiting forbearance.
- 6.6% resulted in loans paid off through either a refinance or by selling the home.
- The remaining 1.2% resulted in repayment plans, short sales, deed-in-lieus or other reasons.
- Total loans serviced that were current (not delinquent or in foreclosure) as a percent of servicing portfolio volume (#) decreased to 95.76% in February from 95.86% in January 2023 (on a non-seasonally adjusted basis).
- States with the highest share of loans current as a percent of servicing portfolio: Washington, Idaho, Colorado, California and Oregon.
- States with the lowest share of loans current as a percent of servicing portfolio: Louisiana, Mississippi, Indiana, New York and West Virginia.
- Total completed loan workouts from 2020 and onward (repayment plans, loan deferrals/partial claims, loan modifications) that were current as a percent of total completed workouts increased to 76.00% in February from 76.03% the previous month.
MBA’s monthly Loan Monitoring Survey (replaced MBA’s Weekly Forbearance and Call Volume Survey in November 2021) represents 65% of the first-mortgage servicing market (32.7 million loans). To subscribe to the full report, go to www.mba.org/loanmonitoring.
NOTES: For more detailed information on performance metrics, including seasonally adjusted delinquency rates by stage (30 days, 60 days, 90+ days), please refer to MBA’s Quarterly National Delinquency Survey at www.mba.org/nds. Fourth-quarter 2022 results were released on Thursday, February 16.
For more information on COVID-19 mortgage forbearance and eligibility, click here.