MBA: Share of Mortgage Loans in Forbearance Drops to 0.49% in May
(Courtesy MBA)
The total number of loans now in forbearance decreased to 0.49% for May from 0.51% of servicers’ portfolio volume in April, the Mortgage Bankers Association’s monthly Loan Monitoring Survey reported.
MBA estimated 245,000 homeowners are in forbearance plans. Mortgage servicers have provided forbearance to approximately 7.9 million borrowers since March 2020.
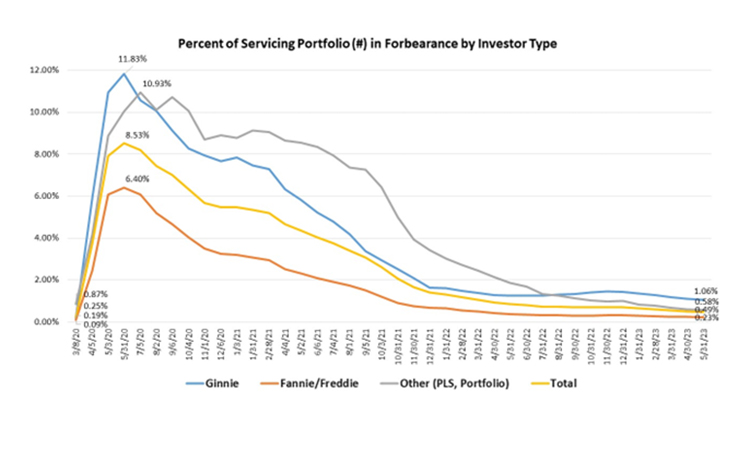
The share of Fannie Mae and Freddie Mac loans in forbearance decreased 1 basis point to 0.23%. Ginnie Mae loans in forbearance decreased 5 basis points to 1.06%, and the forbearance share for portfolio loans and private-label securities decreased 3 basis points to 0.58%.
“The number of loans in forbearance is reaching levels not seen since the beginning of March 2020, prior to the passage of the CARES Act,” said Marina Walsh, CMB, MBA’s Vice President of Industry Analysis. “Today, more than 96% of homeowners are current on their mortgages, thanks to the favorable jobs market and the success of loss mitigation options over the past three years.”
Key Findings of MBA’s Loan Monitoring Survey for May
Total loans in forbearance decreased by 2 basis points in May 2023 relative to April 2023: from 0.51% to 0.49%.
• By investor type, the share of Ginnie Mae loans in forbearance decreased relative to the prior month: from 1.11% to 1.06%.
• The share of Fannie Mae and Freddie Mac loans in forbearance decreased relative to the prior month: from 0.24% to 0.23%.
• The share of other loans (e.g., portfolio and PLS loans) in forbearance decreased relative to the prior month: from 0.61% to 0.58%.
Loans in forbearance as a share of servicing portfolio volume (#) as of May 31:
• Total: 0.49% (previous month: 0.51%)
• Independent Mortgage Banks (IMBs): 0.64% (previous month: 0.68%)
• Depositories: 0.34% (previous month: 0.35%)
By stage, 34.9% of total loans in forbearance are in the initial forbearance plan stage, while 52.6% are in a forbearance extension. The remaining 12.5% are forbearance re-entries, including re-entries with extensions.
Of the cumulative forbearance exits for the period from June 1, 2020, through May 31, at the time of forbearance exit:
• 29.6% resulted in a loan deferral/partial claim.
• 17.9% represented borrowers who continued to make their monthly payments during their forbearance period.
• 17.8% represented borrowers who did not make all of their monthly payments and exited forbearance without a loss mitigation plan in place yet.
• 16.1% resulted in a loan modification or trial loan modification.
• 10.8% resulted in reinstatements, in which past-due amounts are paid back when exiting forbearance.
• 6.6% resulted in loans paid off through either a refinance or by selling the home.
• The remaining 1.2% resulted in repayment plans, short sales, deed-in-lieus or other reasons.
Total loans serviced that were current (not delinquent or in foreclosure) as a percent of servicing portfolio volume (#) increased to 96.12% in May from 95.89% in April (on a non-seasonally adjusted basis).
• The five states with the highest share of loans that were current as a percent of servicing portfolio: Washington, Idaho, Colorado, California, and Oregon.
• The five states with the lowest share of loans that were current as a percent of servicing portfolio: Louisiana, Mississippi, West Virginia, New York, and Indiana.
Total completed loan workouts from 2020 and onward (repayment plans, loan deferrals/partial claims, loan modifications) that were current as a percent of total completed workouts increased to 74.93% in May from 74.39% the previous month.
MBA’s monthly Loan Monitoring Survey (which replaced MBA’s Weekly Forbearance and Call Volume Survey in November 2021) covers the period from May 1 through May 31, 2023, and represents 66% of the first-mortgage servicing market (32.8 million loans). To subscribe to the full report, go to www.mba.org/loanmonitoring.