MBA Chart of the Week July 17, 2023: IMB Production Expenses Vs. Gross Production Expenses
(Source: MBA’s Quarterly Mortgage Bankers Performance Report )
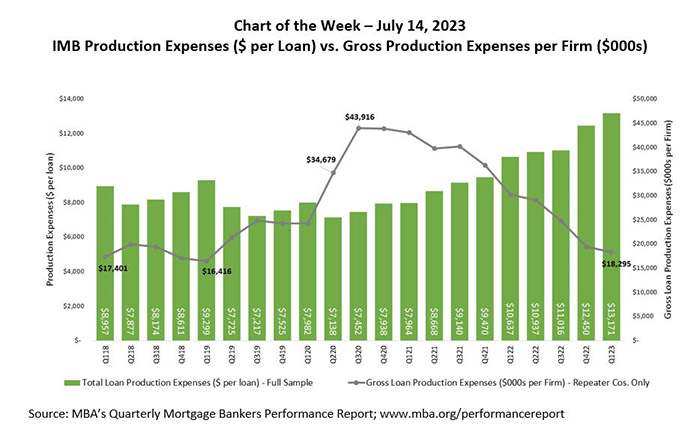
In May, MBA Research released the first quarter results of its Quarterly Mortgage Bankers Performance Report (QPR). Total loan production expenses – commissions, compensation, occupancy, equipment, and other production expenses and corporate allocations – increased to a study-high of $13,171 per loan in the first quarter, up from $12,450 per loan in the fourth quarter of 2022. An analysis of this dramatic increase in costs per loan using gross production expense shows that the main culprit is loan volume and not a lack of effort to reduce costs by these mortgage companies.
This week’s MBA Chart of the Week compares simple average production expenses per-loan to the average gross production expenses per firm, including only repeater companies who reported consistently throughout the five-year period from 2018 – 2023. The $7,138 per loan reported in the second quarter of 2020 marked the lowest level reported for this timeframe. After that quarter, per-loan costs rose continuously through the first quarter of 2023. As for gross production expenses, firms posted a steep increase in costs between the second quarter of 2020 and the third quarter of 2020. After reaching the peak of $43.9 million in total production expenses per firm, gross costs declined by over 58 percent to $18.3 million in the first quarter of 2023 – a level of expense similar to 2018 and the first quarter of 2019.
The trend in gross production expenses shows the substantial efforts of mortgage lenders to match production costs with anticipated market realities. On the other hand, recent per-loan expense trends show the difficulty in fully adjusting costs for a substantial volume downturn over a short period, especially in light of the fixed costs necessary to operate a compliant mortgage operation.
Note: In the first quarter of 2023, the sample size for the production costs per loan was 312 independent mortgage bankers and mortgage subsidiaries of chartered banks. For the repeater company, “same store” analyses for gross expenses over this five-year period, the sample size was 101 companies.
Results for the second quarter of 2023 will be released in the third week of August.