KBRA: Securitized Multifamily and the Housing Affordability Gap

(Image courtesy Max Rahubovskiy/Pexels.com)
Since 2020, greater apartment rent increases occurred in markets with higher homeownership costs as lower affordability drove up demand for rental units, reported KBRA, New York.
“These recent rental rate trends and their correlation with homeownership affordability can also be informative of future rent changes,” KBRA said in a new report, Securitized Multifamily and the Housing Affordability Gap.
KBRA analyzed multifamily exposure in the 30 largest U.S. metros across securitized private-label CMBS conduits and Freddie Mac K-Series fixed-rate collateral to study the affordability gap between homeownership and multifamily rentals in those markets. The data firm used the Federal Reserve Bank of Atlanta’s Home Ownership Affordability Monitor to determine homeownership costs by market and the National Apartment Association’s Q4 2022 Affordability Watch report to identify rental costs. KBRA then compared the percentage cost differential between the two within each metro to determine the “affordability gap” between homeownership and rentals.
At the national level, 40.9% of income, on average, was required to own a median-priced home, based on HOAM data through April 2023. Meanwhile, a 32.5% rent-to-income ratio was reported in the NAA Affordability Watch as of Q4 2022 for renting an apartment. “This implies an affordability gap of 8.4%, making rentals more affordable than homeownership at a national level,” KBRA said, noting that the homeownership percentage was based on the median monthly payment (principal and interest, property taxes, insurance and private mortgage insurance) for a full year as a share of median income and for rental units, the index is the U.S. median rent as a percentage of U.S. median income.
Measuring Housing Affordability by Metro
KBRA examined the affordability data for the 30 largest metros as reported by the Census Bureau’s 2022 population estimate. The top 30 metros account for $18.4 billion (56.4%) of the $32.6 billion of outstanding conduit multifamily loans, and $110.4 billion (62.3%) of the $177 billion of outstanding Freddie Mac fixed-rate loans. (KBRA used Trepp data for the loan analysis as of end-July 2023; defeased loans are excluded.)
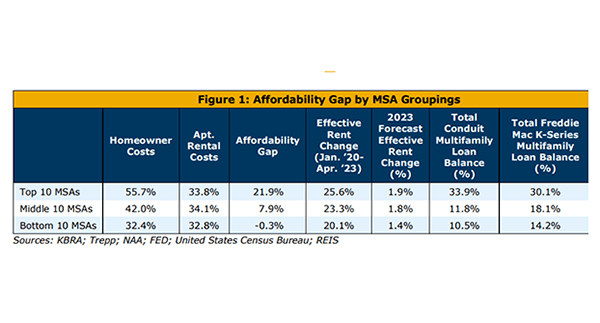
“Of the 30 largest U.S. metros, the top 10 had an affordability gap of 21.9%, implying it was cheaper to rent, while the bottom 10 had a gap of minus 0.3%, suggesting it was on average cheaper to own in these markets,” KBRA said. “The two highest affordability gaps were in San Francisco (45%) and Los Angeles (43.5%), largely due to high home prices.”
The bottom two metros based on their affordability gap are Cincinnati (-5.1%) and Baltimore (-3.3%), where it costs less to own than to rent. This again could partly reflect those area’s lower median home prices of $251,667 and $338,333, respectively, KBRA noted.
Homeownership Impact on Rental Rates
“In higher homeownership cost markets, in general, there were greater rent increases as affordability/demand supported higher apartment rents,” the report said. For the top 10 metros, with an average affordability gap of 21.9%, the effective rent increase from January 2020 to April 2023 was an average of 25.6%, according to REIS, with a 1.9% projected rent increase for full-year 2023 (see Figure 1). The results for each grouping of 10 metros followed a similar pattern with the middle 10 metros experiencing average rent increases of 23.3% (full-year 1.8% projected), while the bottom 10 were at 20.1% (full-year 1.4% projected) during the same period.
“Slower rent increases could partly be due to a slowing in pandemic migration, which stimulated multifamily demand,” the report said.