Housing Market Roundup Sept. 15, 2022

Here’s a quick summary of recent housing market reports that have come across the MBA NewsLink desk:
CoreLogic: 2Q Average Home Equity Reaches Record-High $300,000
CoreLogic, Irvine, Calif., said U.S. homeowners with mortgages (63% of all properties) saw equity increase by 27.8% year over year, representing a collective gain of $3.6 trillion, for an average of $60,200 per borrower, since the second quarter.
The company’s quarterly Homeowner Equity Report noted although U.S. home price growth slowed on an annual basis in the second quarter, homeowners continued to gain near-record equity from a year ago, with 15 states posting higher gains than the national average, led by Hawaii, California and Florida. Total average equity per borrower has now reached nearly $300,000, the highest in the data series. Home price growth and the refinance boom of the last two years have helped bring down the national average loan-to-value ratio to 42%, the lowest in the data series since 2010.
“For many households, home equity is the only source of wealth creation,” said Selma Hepp, interim lead and Deputy Chief Economist for CoreLogic. “As a result, recent record gains in equity and record declines in loan-to-value ratios will provide many owners with a financial buffer in case economic conditions worsen. In addition, record equity continues to provide fuel for housing demand, particularly if households are relocating to more affordable areas.”
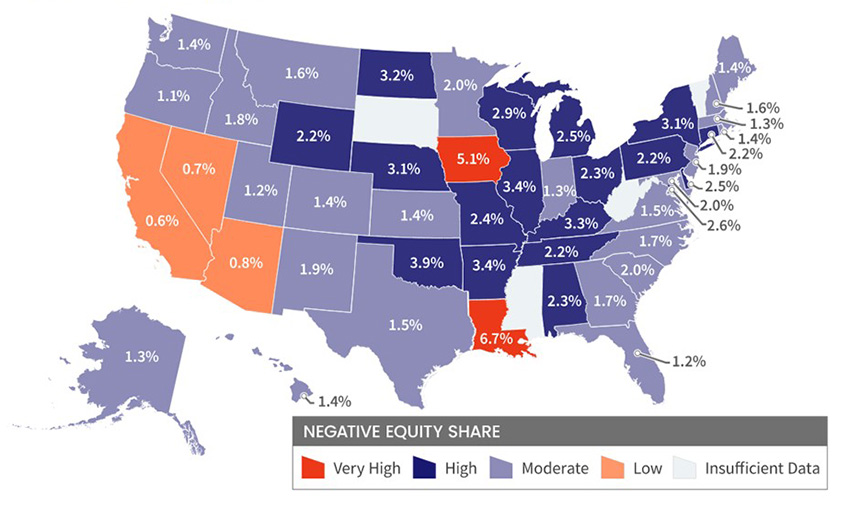
The report said through the second quarter, mortgaged homes in negative equity decreased by 7% to one million homes, or just 1.8% of all mortgaged properties. By comparison, a year ago, 1.3 million homes, or 2.3% of all mortgaged properties, were in negative equity. This number declined by 18% in the second quarter.
CoreLogic said should home prices increase by 5% in the third quarter, 116,000 homes would regain equity; if home prices decline by 5%, 148,000 properties would fall underwater. The CoreLogic HPI Forecast TM projects home prices to increase by 4.3% through June 2023.
The report said 15 states posting higher gains than the national average, led by Hawaii, California and Florida at $129,800, $117,000 and $100,000 respectively. Washington, D.C. and Iowa experienced the lowest average equity gains in the second quarter, at $16,900 and $17,600 respectively.
Black Knight: Mortgage Production Hits 4-Year Low
Black Knight, Jacksonville, Fla., said with mortgage interest rates up 50 basis points between July and August, mortgage production fell in August to a four-year low.
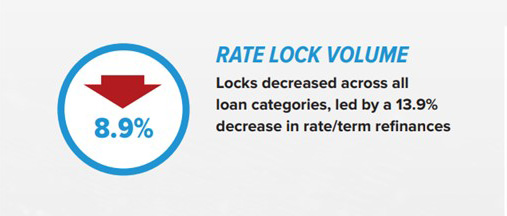
The company’s monthly Originations Market Monitor Report said overall rate locks fell by 8.9 percent from July, marking the second consecutive month that the number of purchase locks has fallen below pre-pandemic levels amid affordability headwinds
The report said rate/term refis fell by 13.9%–down by 94.5% from a year ago—while cash-outs – which had been somewhat insulated early in the rate cycle – fell by 8.9% month over month and by 72.2% year over year. Purchase locks, which now account for 82% of volume, fell by 8.7% month over month and by 28.2% year over year). Meanwhile, 30-year mortgage rates rose to 5.89% by the end of August, a jump of 50 basis points from July.
“Mortgage originators continue to feel the effects of interest rate and affordability challenges,” said Scott Happ, president of Optimal Blue, a division of Black Knight. “Facing headwinds of higher rates and a move into the traditionally slower purchasing months, rate lock volumes fell nearly 9% overall in August to their lowest level since December 2019. Purchase lock counts, which exclude the impact of soaring home values on volume, are off 30% from last year. That count is now down more than 16% from 2019, marking the second consecutive month the number of purchase locks have fallen below pre-pandemic levels, as well as the lowest August count in more than four years.”
The report noted purchases continue to make up the largest share of rate locks (82%) since Optimal Blue began tracking the data in 2018, despite high home prices, lack of inventory and a higher rate environment.
The report said government loan products continued to gain market share as FHA lock activity increased at the expense of both conventional and non-conforming loan volumes, a trend also likely reflected in another decline in the average loan amount – from $344,000 to $340,000. The overall average credit score in August held steady at 722.
Four Western States, Florida at Most Risk for Wildfire Damages
CoreLogic, Irvine, Calif., said California—the most populous state in the U.S. and also with the largest number of properties—is once again the state where owners run the greatest risk of wildfire damage. Florida, Texas, Colorado and New Mexico round out the top five other riskiest housing markets for wildfire damages.
The company’s annual Wildfire Report, which tracks wildfire risks in 15 Western U.S. states and Florida, said climate change and the Western region’s severe drought of recent years has only exacerbated the issue. Decreasing water levels in the Colorado River and Lake Mead, along with declines in snowpacks, have contributed to a longer wildfire season by an average of three months, resulting in a 1,500% increase in burn areas. Over the past decade, CoreLogic data found that wildfires burned an average of 6.8 million acres per year, with that number topping 10 million acres in three of those years.
Also complicating matters, the report said, California also faces firefighter shortages. The Golden State employed about 25% fewer of these crucial first responders in the summer than initially projected, amounting to 1,300 unfilled jobs.
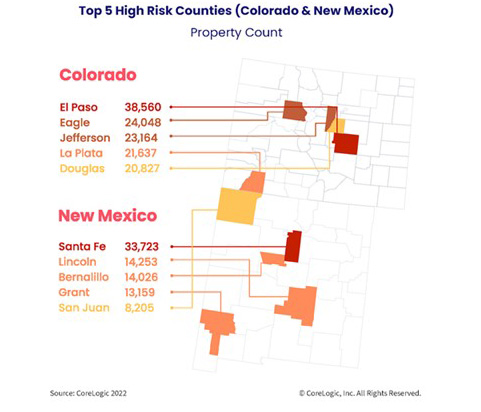
The report said two counties in Colorado and New Mexico have particularly concerning wildfire damage risks, given the number of homes that could be impacted. In Colorado’s El Paso County – the state’s most heavily populated and home to Colorado Springs – a wildfire could affect 39,000 homes. Santa Fe County, N.M., has an even greater percentage of risk given it is much smaller.
“Consuming thousands of homes in the U.S. every year, wildfires present a real and present threat to our families and communities,” said Tom Larsen, senior director of Insurance solutions at CoreLogic. “Mitigating this risk will require commitment from homeowners, first responders, insurers and regulators. A first step in achieving the resilient communities we seek is to quantify what is at risk.”
Last week, Redfin, Seattle, reported more than half of homes being built today face fire risk, compared to 14% of homes built from 1900 to 1959, as suburbanization and a shift to the Sun Belt push builders into more vulnerable areas.
The report said more than half (55%) of homes built so far this decade face fire risk, while 45% face drought risk. By comparison, just 14% of homes built from 1900 to 1959 face fire risk and 37% face drought risk. New homes are also more likely than older homes to face heat and flood risk, but the gap is largest when it comes to fire and drought.
Overall, heat is the most common danger, with nearly 100% of homes constructed in the last two years at risk. Heat risk is based on the number of extremely hot days expected in the future. Next comes storm (78%), followed by fire (55%), drought (45%) and flood (25%). Storm is the only risk more likely to plague older homes. That’s likely because many of the country’s old homes are located in the storm-prone Northeast.
The report noted while new homes are increasingly being built in disaster-prone areas, most of America’s housing stock is not new. Two-thirds of U.S. homes were built before 1990, while about 4% were built in 2014 or later, according to U.S. Census Bureau estimates. However, the share of homes constructed in fire-prone areas has been steadily increasing since the 1960s as builders have expanded beyond dense cities and into areas with more flammable vegetation. More than half (55%) of homes built so far this decade face fire risk, compared with 19% of homes built in the 1960s and 8% of homes built from 1900 to 1910.
Separately, Redfin reported homebuyers who have access to flood-risk information when browsing home listings online are more likely to view and make offers on homes with lower flood risk than those who don’t have access. That’s according to a three-month randomized controlled trial involving 17.5 million Redfin.com users, half of which had access to property-level flood-risk scores (treatment group) and half of which did not (control group).
“We now have definitive evidence that the risks posed by climate change are affecting where Americans choose to live,” said Redfin Chief Economist Daryl Fairweather. “Equipping people with flood-risk information helps them make more informed decisions. Some will opt to move out of risky areas altogether, while others will stay put but invest in making their homes more resilient to disaster.”
ATTOM: California, New Jersey, Illinois Top List of Vulnerable Housing Markets
ATTOM, Irvine, Calif., released a Special Housing Risk Report spotlighting county-level housing markets around the United States that are more or less vulnerable to declines, based on home affordability, unemployment and other measures in the second quarter.
The report shows New Jersey, Illinois and inland California continued to have the highest concentrations of the most-at-risk markets in the second quarter – with the largest clusters in the New York City and Chicago areas. Southern and midwestern states remained less exposed.
Second-quarter patterns – based on gaps in home affordability, underwater mortgages, foreclosures and unemployment – showed New Jersey, Illinois and California had 33 of the 50 counties most vulnerable to potential declines. The 50 most at-risk included nine in and around New York City, six in the Chicago metropolitan area and 13 spread through northern, central and southern California. The rest of the top 50 counties were scattered across the U.S., including three in the Philadelphia metro area. At the other end of the risk spectrum, the South and Midwest had the highest concentration of markets considered least vulnerable to falling housing markets.
“The Federal Reserve has promised to be as aggressive as it needs to be in order to get inflation under control, even if its actions lead to a recession,” said Rick Sharga, executive vice president of market intelligence at ATTOM. “Given how little progress has been made reducing inflation so far, the Fed’s actions seem more and more likely to drive the economy into a recession, and some housing markets are going to be more vulnerable than others if that happens.”
Counties were considered more or less at risk based on the percentage of homes facing possible foreclosure, the portion with mortgage balances that exceeded estimated property values, the percentage of average local wages required to pay for major home ownership expenses on median-priced single-family homes, and local unemployment rates. The conclusions were drawn from an analysis of the most recent home affordability, equity and foreclosure reports prepared by ATTOM. Unemployment rates came from federal government data. Rankings were based on a combination of those four categories in 575 counties around the United States with sufficient data to analyze in the second quarter of 2022. Counties were ranked in each category, from lowest to highest, with the overall conclusion based on a combination of the four ranks.
Twenty-five of the 50 counties least vulnerable to housing-market problems from among the 575 included in the second-quarter report were in the South, while another 14 were in the Midwest. Just five were in the West and six in the Northeast.
CoreLogic: June Mortgage Delinquencies Edge Up, Remain Near Record Low
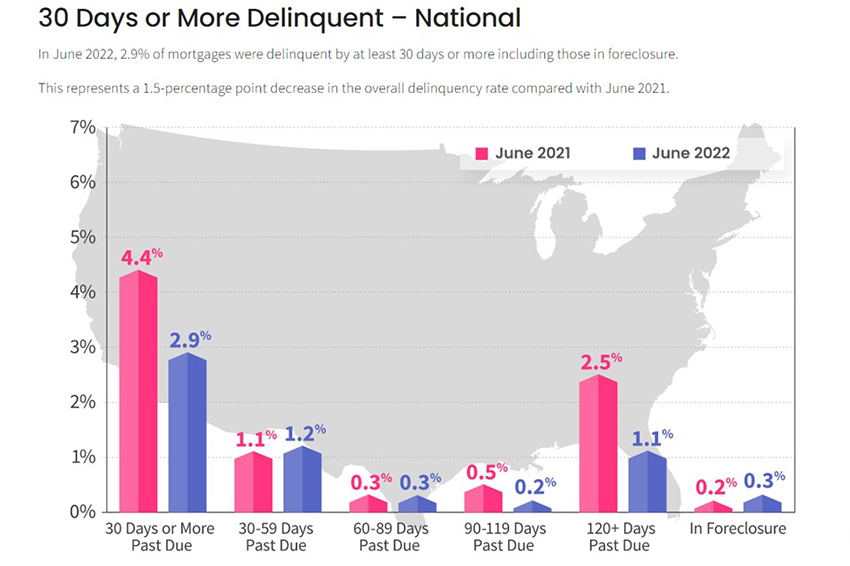
CoreLogic, Irvine, Calif., released its monthly Loan Performance Insights Report for June, reporting 2.9% of all mortgages in June were in some stage of delinquency (30 days or more past due, including those in foreclosure), a 1.5 percentage point decrease from 4.4% a year ago.
Key findings:
–Early-Stage Delinquencies (30 to 59 days past due): 1.2%, up from 1.1% a year ago.
–Adverse Delinquency (60 to 89 days past due): 0.3%, unchanged from a year ago.
–Serious Delinquency (90 days or more past due, including loans in foreclosure): 1.3%, down from 3% a year ago and a high of 4.3% in August 2020.
–Foreclosure Inventory Rate (the share of mortgages in some stage of the foreclosure process): 0.3%, up from 0.2% a year ago.
–Transition Rate (the share of mortgages that transitioned from current to 30 days past due): 0.7%, up from 0.6% a year ago.
“While early-stage delinquencies edged up in June, they remained near historic lows through the first half of 2022,” said Molly Boesel, principal economist with CoreLogic. “Later-stage delinquencies fell by 60% from June 2021, with only a small increase in foreclosures, indicating that delinquent borrowers are able to find alternatives to foreclosure.”
All states posted annual declines in their overall delinquency rates. States with the largest declines were Hawaii and Nevada (both down 2.6 percentage points), New Jersey (down 2.4 percentage points) and New York (down 2.3 percentage points). The remaining states, including the District of Columbia, registered annual delinquency rate drops between 2.1 percentage points and 0.4 percentage points.
All U.S. metro areas posted at least a small annual decrease in overall delinquency rates, with Kahului-Wailuku-Lahina, Hawaii (down 4.2 percentage points), Odessa, Texas (down 4.1 percentage points) and Atlantic City-Hammonton, N.J. (down 3.3 percentage points) posting the largest decreases.