MBA: Homebuyer Affordability Drops in September Amid Surge in Mortgage Rates

Homebuyer affordability dropped in September, as the national median payment applied for by applicants increased by 5.5 percent to $1,941 from $1,839 in August, according to the Mortgage Bankers Association’s Purchase Applications Payment Index.
“Homebuyer affordability took an enormous hit in September, with the 75-basis-point jump in mortgage rates leading to the typical homebuyer’s monthly payment rising $102 from August,” said Edward Seiler, MBA Associate Vice President of Housing Economics, and Executive Director with Research Institute for Housing America. “With mortgage rates continuing to rise, the purchasing power of borrowers is shrinking. The median loan amount in September was $305,550 – much lower than the February peak of $340,000.”
Seiler said MBA expects supply and affordability constraints and economic uncertainty to continue to hamper the purchase market. Purchase origination volume is forecast to decrease 3.3 percent next year to $1.53 trillion.”
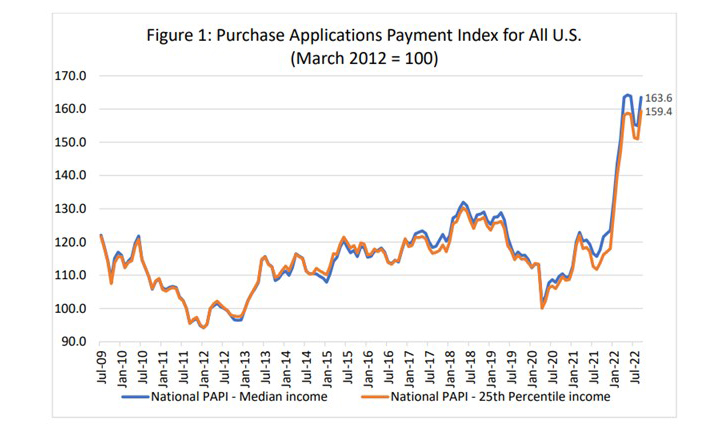
The national PAPI (Figure 1) increased 5.5 percent to 163.6 in September from 155.0 in August – this increase reverses four consecutive months of declines from a high of 164.2 in May. From a year ago (117.6), the index has jumped 32.5 percent in the first nine months of 2022. For borrowers applying for lower-payment mortgages (the 25th percentile), the national mortgage payment increased to $1,271 in September from $1,210 in August.
Additional Key Findings of the MBA Purchase Applications Payment Index – September
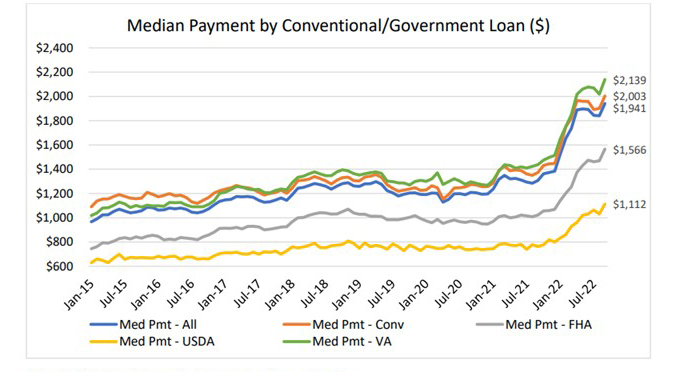
• The national median mortgage payment rose to $1,941 in September, up from $1,839 in August and from $1,844 in July. It is up by $558 in the first nine months of the year, equal to a 40.4% increase.
• The national median mortgage payment for FHA loan applicants rose to $1,566 in September, up from $1,469 in August and $1,022 in September 2021.
• The national median mortgage payment for conventional loan applicants rose to $2,003, up from $1,901 in August and $1,373 in September 2021.
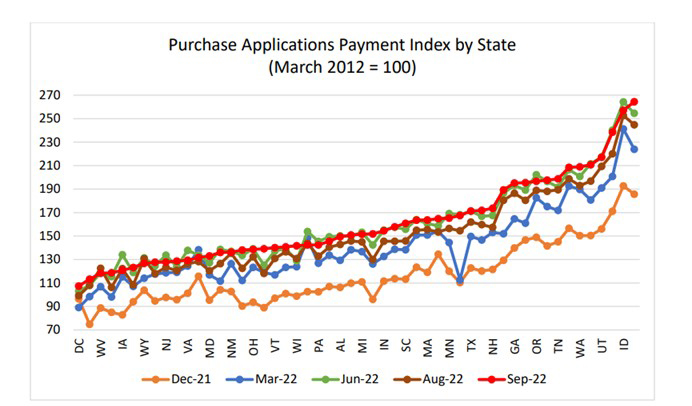
• States with the highest PAPI were: Nevada (264.4), Idaho (257.0), Arizona (238.5), Utah (217.0) and Florida (210.7).
• States with the lowest PAPI were: Washington, D.C. (107.4), Connecticut (113.2), West Virginia (118.3), Alaska (118.7) and Iowa (120.7).
• Homebuyer affordability decreased for Black households, with the national PAPI increasing from 155.4 in August to 164.0 in September.
• Homebuyer affordability decreased for Hispanic households, with the national PAPI increasing from 142.0 in August to 149.9 in September.
• Homebuyer affordability decreased for White households, with the national PAPI increasing from 155.3 in August to 163.9 in September.
The PAPI measures how new monthly mortgage payments vary across time – relative to income – using data from the MBA Weekly Applications Survey. An increase in the PAPI – indicative of declining borrower affordability conditions – means the mortgage payment to income ratio is higher due to increasing application loan amounts, rising mortgage rates, or a decrease in earnings. A decrease in PAPI – indicative of improving borrower affordability conditions – occurs when loan application amounts decrease, mortgage rates decrease, or earnings increase.
PAPI uses usual weekly earnings data from the U.S. Bureau of Labor Statistics’ Current Population Survey. Usual weekly earnings represent full-time wage and salary earnings before taxes and other deductions and include any overtime pay, commissions, or tips usually received. Note that data are not seasonally adjusted.
The rent data series calculated for MBA’s national mortgage payment to rent ratio comes from the U.S. Census Bureau’s Housing Vacancies and Homeownership survey’s median asking rent. The HVS data is quarterly, and as such, the mortgage payment to rent ratio will be updated quarterly. Note: MPPR data is not included in this September 2022 release.
For additional information on MBA’s Purchase Applications Payment Index, click here.