October Mortgage Application Payments Rise 3.7 Percent to $2,012
Homebuyer affordability continued its downward trajectory in October, as the national median payment applied for by applicants increased 3.7 percent to $2,012 from $1,941 in September, according to the Mortgage Bankers Association’s Purchase Applications Payment Index.
“Prospective homebuyers continued to feel the effects of higher mortgage rates in October, with the 70-basis-point jump in rates leading to the typical monthly mortgage payment rising to a new survey high of $2,012,” said Edward Seiler, MBA Associate Vice President of Housing Economics, and Executive Director of the MBA Research Institute for Housing America. “Higher mortgage rates are also squeezing the purchasing power of prospective buyers. The median loan amount last month decreased to $295,000 – the lowest level since January 2021. Weakening affordability and increased economic uncertainty are expected to slow homebuying activity in the final two months of the year.”
PAPI measures how new monthly mortgage payments vary across time – relative to income – using data from MBA’s Weekly Applications Survey. An increase in PAPI – indicative of declining borrower affordability conditions – means that the mortgage payment to income ratio is higher due to increasing application loan amounts, rising mortgage rates, or a decrease in earnings. A decrease in PAPI – indicative of improving borrower affordability conditions – occurs when loan application amounts decrease, mortgage rates decrease or earnings increase.
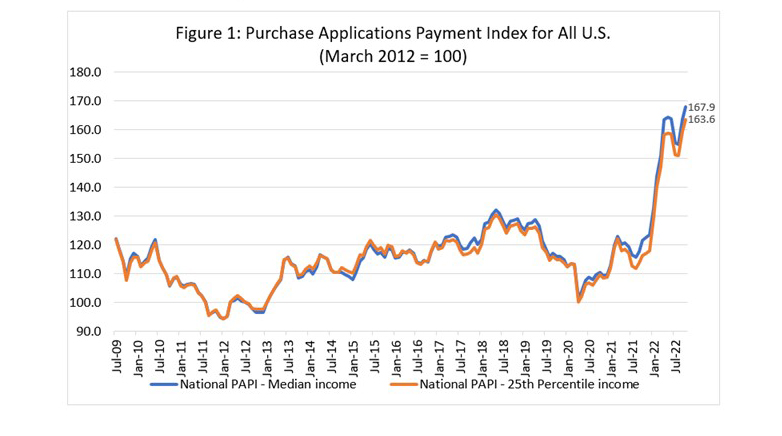
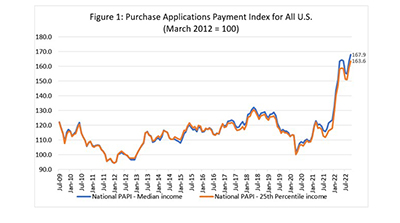
The national PAPI (Figure 1) increased 2.7 percent to 167.9 in October from 163.6 in September. The index eclipsed the previous high of 164.2 in May . The index has jumped 36.0 percent in the first 10 months of 2022 and is up 38.1 percent compared to October 2021 (121.6). For borrowers applying for lower-payment mortgages (the 25th percentile), the national mortgage payment increased to $1,323 in October from $1,271 in September.
MBA’s national mortgage payment to rent ratio increased to 1.46 at the end of the third quarter (September) from 1.44 at the end of the second quarter (June 2022), meaning mortgage payments for home purchases have increased relative to rents. The national median asking rent in third-quarter 2022 increased 1.5 percent on a quarterly basis to $1,334 ($1,314 in second-quarter 2022). The 25th percentile mortgage application payment to median asking rent ratio was 0.95 in September, up from 0.94 in June.
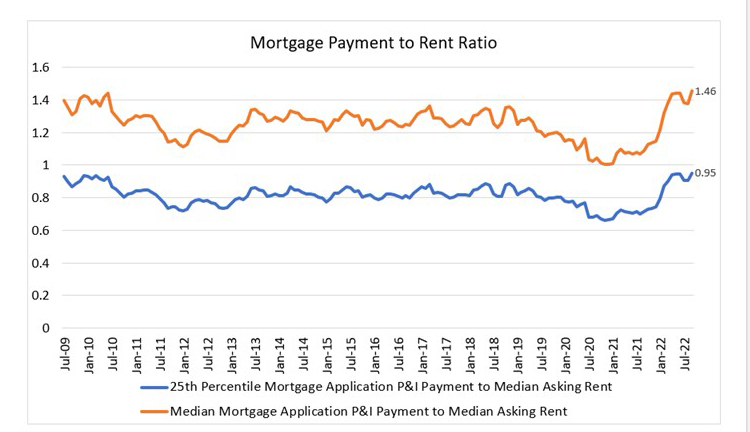
“Median asking rents increased at an annualized 6.2 percent between the second and third quarters of 2022, but have shown some deceleration in recent months,” Seiler said. “Despite the increasing mortgage rates in the third quarter, elevated rental payments kept the MPRR under one for many potential first-time homebuyer who may be looking for a smaller mortgage amount.”
Additional Key Findings of MBA’s Purchase Applications Payment Index – October
• The national median mortgage payment rose to $2,012 in October, up from $1,941 in September and $1,839 in August. Mortgage payments are up by $629 in the first 10 months of the year, equal to a 45.5 percent increase.
• The national median mortgage payment for FHA loan applicants rose to $1,666 in October, up from $1,566 in September and $1,056 in October 2021.
• The national median mortgage payment for conventional loan applicants rose to $2,047, up from $2,003 in September and $1,431 in October 2021.
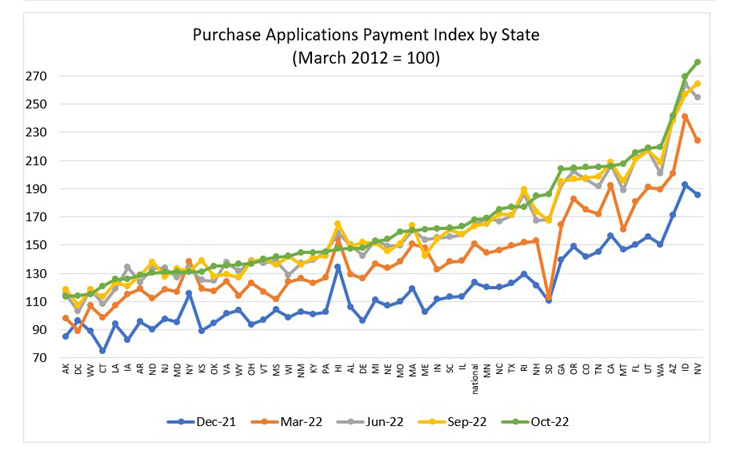
• States with the highest PAPI were: Nevada (279.7), Idaho (269.7), Arizona (241.7), Washington (219.7) and Utah (218.9).
• States with the lowest PAPI were: Alaska (113.6), Washington, D.C. (114.2), West Virginia (115.1), Connecticut (120.9) and Louisiana (125.6).
• Homebuyer affordability decreased for Black households, with the national PAPI increasing from 164.0 in September to 168.4 in October.
• Homebuyer affordability decreased for Hispanic households, with the national PAPI increasing from 149.9 in September to 153.9 in October.
• Homebuyer affordability decreased for White households, with the national PAPI increasing from 163.9 in September to 168.3 in October.
About MBA’s Purchase Applications Payment Index
The Mortgage Bankers Association’s Purchase Applications Payment Index measures how new mortgage payments vary across time relative to income. Higher index values indicate that the mortgage payment to income ratio is higher than in a month where the index is lower. Contrary to other affordability indexes that make multiple assumptions about mortgage underwriting criteria to estimate mortgage payment level, PAPI directly uses MBA’s Weekly Applications Survey data to calculate mortgage payments.
PAPI uses usual weekly earnings data from the U.S. Bureau of Labor Statistics’ Current Population Survey. Usual weekly earnings represent full-time wage and salary earnings before taxes and other deductions and include any overtime pay, commissions, or tips usually received. Note that data are not seasonally adjusted.
The rent data series calculated for MBA’s national mortgage payment to rent ratio comes from the U.S. Census Bureau’s Housing Vacancies and Homeownership survey’s median asking rent. The HVS data is quarterly, and as such, the mortgage payment to rent ratio will be updated quarterly.
For additional information on MBA’s Purchase Applications Payment Index, click here.