MBA: October Share of Mortgage Loans In Forbearance Up Slightly

The Mortgage Bankers Association’s monthly Loan Monitoring Survey reported loans in forbearance increased by 1 basis point to 0.70% of servicers’ portfolio volume from 0.69% in the prior month as of October 31.
MBA estimates 350,000 homeowners are in forbearance plans.
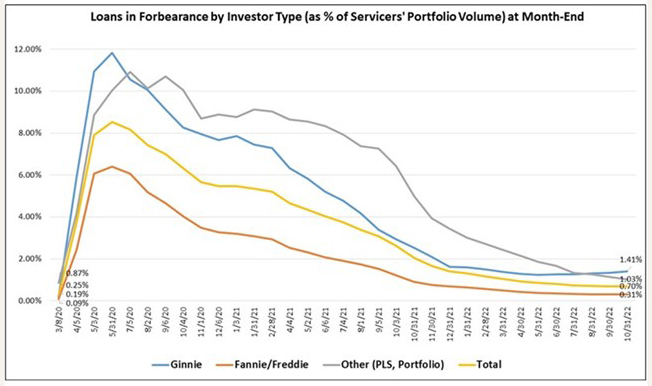
The report said the share of Fannie Mae and Freddie Mac loans in forbearance increased by 1 basis point to 0.31%. Ginnie Mae loans in forbearance increased by 8 basis points to 1.41%, while the forbearance share for portfolio loans and private-label securities declined by 11 basis points to 1.03%.
“The overall share of loans in forbearance increased slightly in October, but it was a mixed bag by investor type,” said Marina Walsh, CMB, MBA Vice President of Industry Analysis. “Several factors were behind the first monthly increase in forbearances in 29 months, including the effects of Hurricane Ian in the Southeast, the diminishing number of loans bought out of Ginnie Mae pools and placed in portfolio and the fact that new forbearance requests have closely matched forbearance exits for the past three months.”
MBA’s Loan Monitoring Survey requests that servicers report all loans in forbearance regardless of the borrower’s stated reason – whether pandemic-related, due to a natural disaster or another cause.
“Added Walsh, “The overall share of loans that were current last month decreased 15 basis points to 95.70%, with 44 states reporting declines (not delinquent or in foreclosure).
“Florida, which was hit the hardest by Hurricane Ian, experienced a 49-basis-point drop in the share of loans that were current – the biggest decline of all states,” Walsh said.
Key Findings of MBA’s Loan Monitoring Survey – October 1 – 31
- Total loans in forbearance increased by 1 basis point in October, from 0.69% to 0.70%.
- By investor type, the share of Ginnie Mae loans in forbearance increased from 1.33% to 1.41%.
- The share of Fannie Mae and Freddie Mac loans in forbearance increased from 0.30% to 0.31%.
- The share of other loans (e.g., portfolio and PLS loans) in forbearance decreased from 1.14% to 1.03%.
- Loans in forbearance as a share of servicing portfolio volume (#) as of October 31, 2022:
- Total: 0.70% (previous month: 0.69%)
- Independent Mortgage Banks (IMBs): 0.96% (previous month: 0.95%)
- Depositories: 0.47% (previous month: 0.48%)
- By stage, 36.7% of total loans in forbearance are in the initial forbearance plan stage, while 50.9% are in a forbearance extension. The remaining 12.4% are forbearance re-entries, including re-entries with extensions.
- Of the cumulative forbearance exits for the period from June 1, 2020, through October 31 ,2022, at the time of forbearance exit:
- 29.6% resulted in a loan deferral/partial claim.
- 18.3% represented borrowers who continued to make their monthly payments during their forbearance period.
- 17.3% represented borrowers who did not make all of their monthly payments and exited forbearance without a loss mitigation plan in place yet.
- 16.0% resulted in a loan modification or trial loan modification.
- 11.0% resulted in reinstatements, in which past-due amounts are paid back when exiting forbearance.
- 6.6% resulted in loans paid off through either a refinance or by selling the home.
- The remaining 1.2% resulted in repayment plans, short sales, deed-in-lieus or other reasons.
- Total loans serviced that were current (not delinquent or in foreclosure) as a percent of servicing portfolio volume (#) decreased to 95.70% in October from 95.85% in September (on a non-seasonally adjusted basis).
- States with the highest share of loans that were current as a percent of servicing portfolio: Washington, Idaho, Colorado, Utah and Oregon.
- States with the lowest share of loans that were current as a percent of servicing portfolio: Mississippi, Louisiana, New York, West Virginia and Indiana.
- The share of loans that were current declined in 44 states compared to the previous month. Of these states, Florida posted the largest monthly decline, dropping 49 basis points to 95.35% in October from 95.84% the previous month.
- Total completed loan workouts from 2020 and onward (repayment plans, loan deferrals/partial claims, loan modifications) that were current as a percent of total completed workouts decreased to 78.16% in October from 78.70% the previous month.
MBA’s monthly Loan Monitoring Survey (replaced MBA’s Weekly Forbearance and Call Volume Survey in November 2021) represents 66% of the first-mortgage servicing market (32.9 million loans). To subscribe to the full report, go to www.mba.org/loanmonitoring.
NOTES: For more detailed information on performance metrics, including seasonally adjusted delinquency rates by stage (30 days, 60 days, 90+ days), please refer to MBA’s Quarterly National Delinquency Survey at www.mba.org/nds. Third-quarter 2022 results were released on Thursday, November 10.