Home Price Appreciation Not Slowing Down Yet
Home prices roared into March like a lion and left March like…well, a lion.
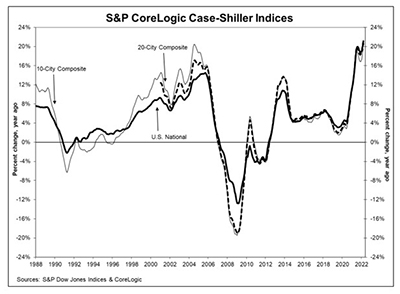
The S&P CoreLogic Case-Shiller National Home Price Index reported a 20.6 percent annual gain in March, up 20 percent in February. The 10-City Composite annual increase came in at 19.5%, up from 18.7% in the previous month. The 20-City Composite posted a 21.2% year-over-year gain, up from 20.3% in the previous month.

Tampa led with a 34.8% year-over-year price increase, followed by Phoenix at 32.4% and Miami at 32.0%. Seventeen of the 20 cities reported higher price increases in the year ending March versus the year ending February.
Month over month, before seasonal adjustment, the National Index posted a 2.6% increase in March, while the 10-City and 20-City Composites posted increases of 2.8% and 3.1%, respectively. After seasonal adjustment, the National Index posted a month-over-month increase of 2.1%, while the 10-City and 20-City Composites posted increases of 2.2% and 2.4%, respectively. All 20 cities reported increases before and after seasonal adjustments.
“Those of us who have been anticipating a deceleration in the growth rate of U.S. home prices will have to wait at least a month longer,” said Craig J. Lazzara, Managing Director at S&P DJI. “For both National and 20-City Composites, March’s reading was the highest year-over-year price change in more than 35 years of data, with the 10-City growth rate at the 99th percentile of its own history.”
Lazzara said the strength of the Composite indices suggests “very broad strength” in the housing market. “Mortgages are becoming more expensive as the Federal Reserve has begun to ratchet up interest rates, suggesting that the macroeconomic environment may not support extraordinary home price growth for much longer,” he said. “Although one can safely predict that price gains will begin to decelerate, the timing of the deceleration is a more difficult call.”
The report said as of March, average home prices for the MSAs within the 10-City and 20-City Composites are exceeding their winter 2007 levels.
“With the Fed’s more aggressive talk on tightening financial conditions and expectations of higher mortgage rates throughout 2022, home buyers rushed into the housing markets in early months of this year, reigniting the buyer frenzy and pushing home price growth to new highs,” said Selma Hepp, Deputy Chief Economist with CoreLogic, Irvine, Calif. “Even monthly increases in home prices reached new post-pandemic highs in the first quarter of 2022. However, since mortgage rates have hit the psychological 5% benchmark, buyers are stepping back and allowing housing market conditions to normalize again. Fewer buyers and more available for-sale inventory means slower growth of home price growth in the months ahead.”
In a separate report, the Federal Housing Finance Agency reported U.S. house prices rose 18.7 percent from the first to second quarter. The FHFA House Price Index said home prices rose by 4.6 percent from the fourth quarter.
“High appreciation rates continued across housing markets during the first quarter,” said William Doerner, Supervisory Economist in FHFA’s Division of Research and Statistics. “Strong demand coupled with tight supply have kept prices climbing. Through the end of March, higher mortgage rates have not yet translated into slower price gains, but new home sales have dropped during the last few months, with a significant falloff in April.”
The report said house prices rose in all 50 states and the District of Columbia between the first and second quarters. Areas with the highest annual appreciation were: 1) Florida 29.8 percent; 2) Arizona 27.5 percent; 3) Utah 26.8 percent; 4) Tennessee 25.8 percent; and 5) Idaho 25.5 percent. Those with the lowest annual appreciation were: 1) District of Columbia 6.6 percent; 2) North Dakota 10.4 percent; 3) Alaska 10.5 percent; 4) Louisiana 12.3 percent; and 5) Iowa 12.5 percent.
Additionally, the report said house prices rose in all of the top 100 largest metropolitan areas over the past four quarters. Annual price increases were greatest in Cape Coral-Fort Myers, Fla., where prices increased by 41.3 percent. Prices were weakest in Cambridge-Newton-Framingham, Mass., where they increased by 9.1 percent.
Of the nine census divisions, the Mountain division recorded the strongest four-quarter appreciation, posting a 24.0 percent gain between the first and second quarters and a 5.7 percent increase in the first quarter. Annual house price appreciation was weakest in the Middle Atlantic division, where prices rose by 14.6 percent quarter over quarter.