MBA: Share of Mortgage Loans in Forbearance Decreases to 1.41% in December
Loans now in forbearance decreased 26 basis points during December to 1.41% of servicers’ portfolio volume as of December 31, the Mortgage Bankers Association’s new monthly Loan Monitoring Survey reported.
MBA estimated 705,000 homeowners are currently in forbearance plans.
The share of Fannie Mae and Freddie Mac loans in forbearance decreased 8 basis points in December to 0.68%. Ginnie Mae loans in forbearance decreased 47 basis points to 1.63% and the forbearance share for portfolio loans and private-label securities declined 51 basis points to 3.43%.
“The share of loans in forbearance continued to decline in December,” said Marina Walsh, CMB, MBA Vice President of Industry Analysis. “This was especially the case for government and private-label and portfolio loans, as those loans have higher levels of forbearance than loans backed by Fannie Mae and Freddie Mac.”
With the number of borrowers in forbearance continuing to decrease below 750,000, the pace of monthly forbearance exits reached its lowest level since MBA started tracking exits in June 2020, Walsh noted.
“It is likely that the remaining borrowers in forbearance have experienced either a permanent hardship that may require more complex loan workout solutions or they have encountered a recent hardship for which they are now seeking relief,” Walsh said.
Key findings of MBA’s Loan Monitoring Survey – December 1-31:
• Total loans in forbearance decreased by 26 basis points in December from November: from 1.67% to 1.41%.
o By investor type, the share of Ginnie Mae loans in forbearance decreased from 2.10% to 1.63%.
o The share of Fannie Mae and Freddie Mac loans in forbearance decreased from 0.76% to 0.68%.
o The share of other loans (e.g., portfolio and PLS loans) in forbearance decreased from 3.94% to 3.43%.
• Loans in forbearance as a share of servicing portfolio volume (#) as of December 31:
o Total: 1.41% (previous month: 1.67%)
o Independent Mortgage Banks (IMBs): 1.66% (previous month: 1.94%)
o Depositories: 1.24% (previous month: 1.52%)
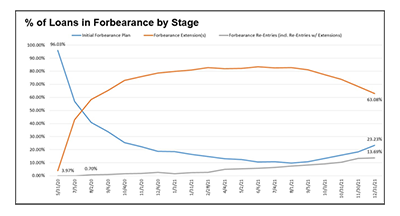
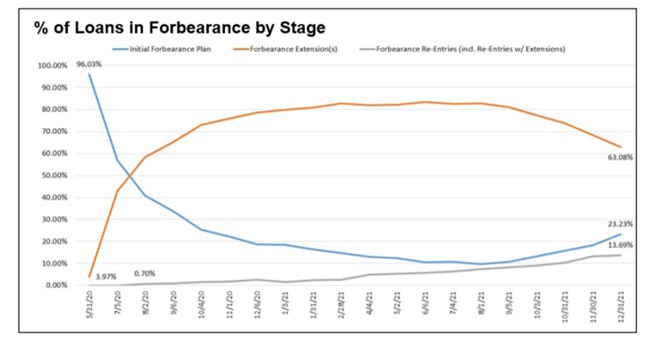
• By stage, 23.2% of total loans in forbearance are in the initial forbearance plan stage, while 63.1% are in a forbearance extension. The remaining 13.7% are forbearance re-entries, including re-entries with extensions.
• Of the cumulative forbearance exits for the period from June 1, 2020, through December 31, 2021, at the time of forbearance exit:
o 29.1% resulted in a loan deferral/partial claim.
o 19.5% represented borrowers who continued to make their monthly payments during their forbearance period.
o 16.9% represented borrowers who did not make all of their monthly payments and exited forbearance without a loss mitigation plan in place yet.
o 14.6% resulted in a loan modification or trial loan modification.
o 11.7% resulted in reinstatements, in which past-due amounts are paid back when exiting forbearance.
o 6.9% resulted in loans paid off through either a refinance or by selling the home.
o The remaining 1.3% resulted in repayment plans, short sales, deed-in-lieus or other reasons.
• Total loans serviced that were current (not delinquent or in foreclosure) as a percent of servicing portfolio volume (#) rose to 94.85% in December from 94.58% in November (on a non-seasonally adjusted basis).
o States with the highest share of loans that were current as a percent of servicing portfolio: Idaho, Washington, Colorado, Utah and Oregon.
o States with the lowest share of loans that were current as a percent of servicing portfolio: Louisiana, Mississippi, New York, Illinois and Indiana.
• Total completed loan workouts from 2020 and onward (repayment plans, loan deferrals/partial claims, loan modifications) that were current as a percent of total completed workouts declined to 83.50% last month from 83.69% in November.
The MBA monthly Loan Monitoring Survey (which replaces the MBA Weekly Forbearance and Call Volume Survey) covers the period from December 1 through December 31 and represents 73% of the first-mortgage servicing market (36.5 million loans). To subscribe to the full report, visit www.mba.org/loanmonitoring.
The next Monthly Loan Monitoring Survey will be released on Tuesday, Feb. 22, at 4:00 p.m. ET. For more detailed information on performance metrics, including seasonally adjusted delinquency rates by stage (30 days, 60 days, 90+ days), refer to MBA’s Quarterly National Delinquency Survey at www.mba.org/nds.